


Hi everyone!
Welcome to the 26th issue of the Viz of the Week newsletter, where I'll be featuring a new visual each week and sharing the code behind it.
If you haven't subscribed and wish to receive these posts straight to your inbox, subscribe to join the community and receive free updates!
For this week's issue, we'll be looking at which Premier League sides have improved their progressive pass accuracy statistics versus the previous season.
The results were quite telling for some team's performances.
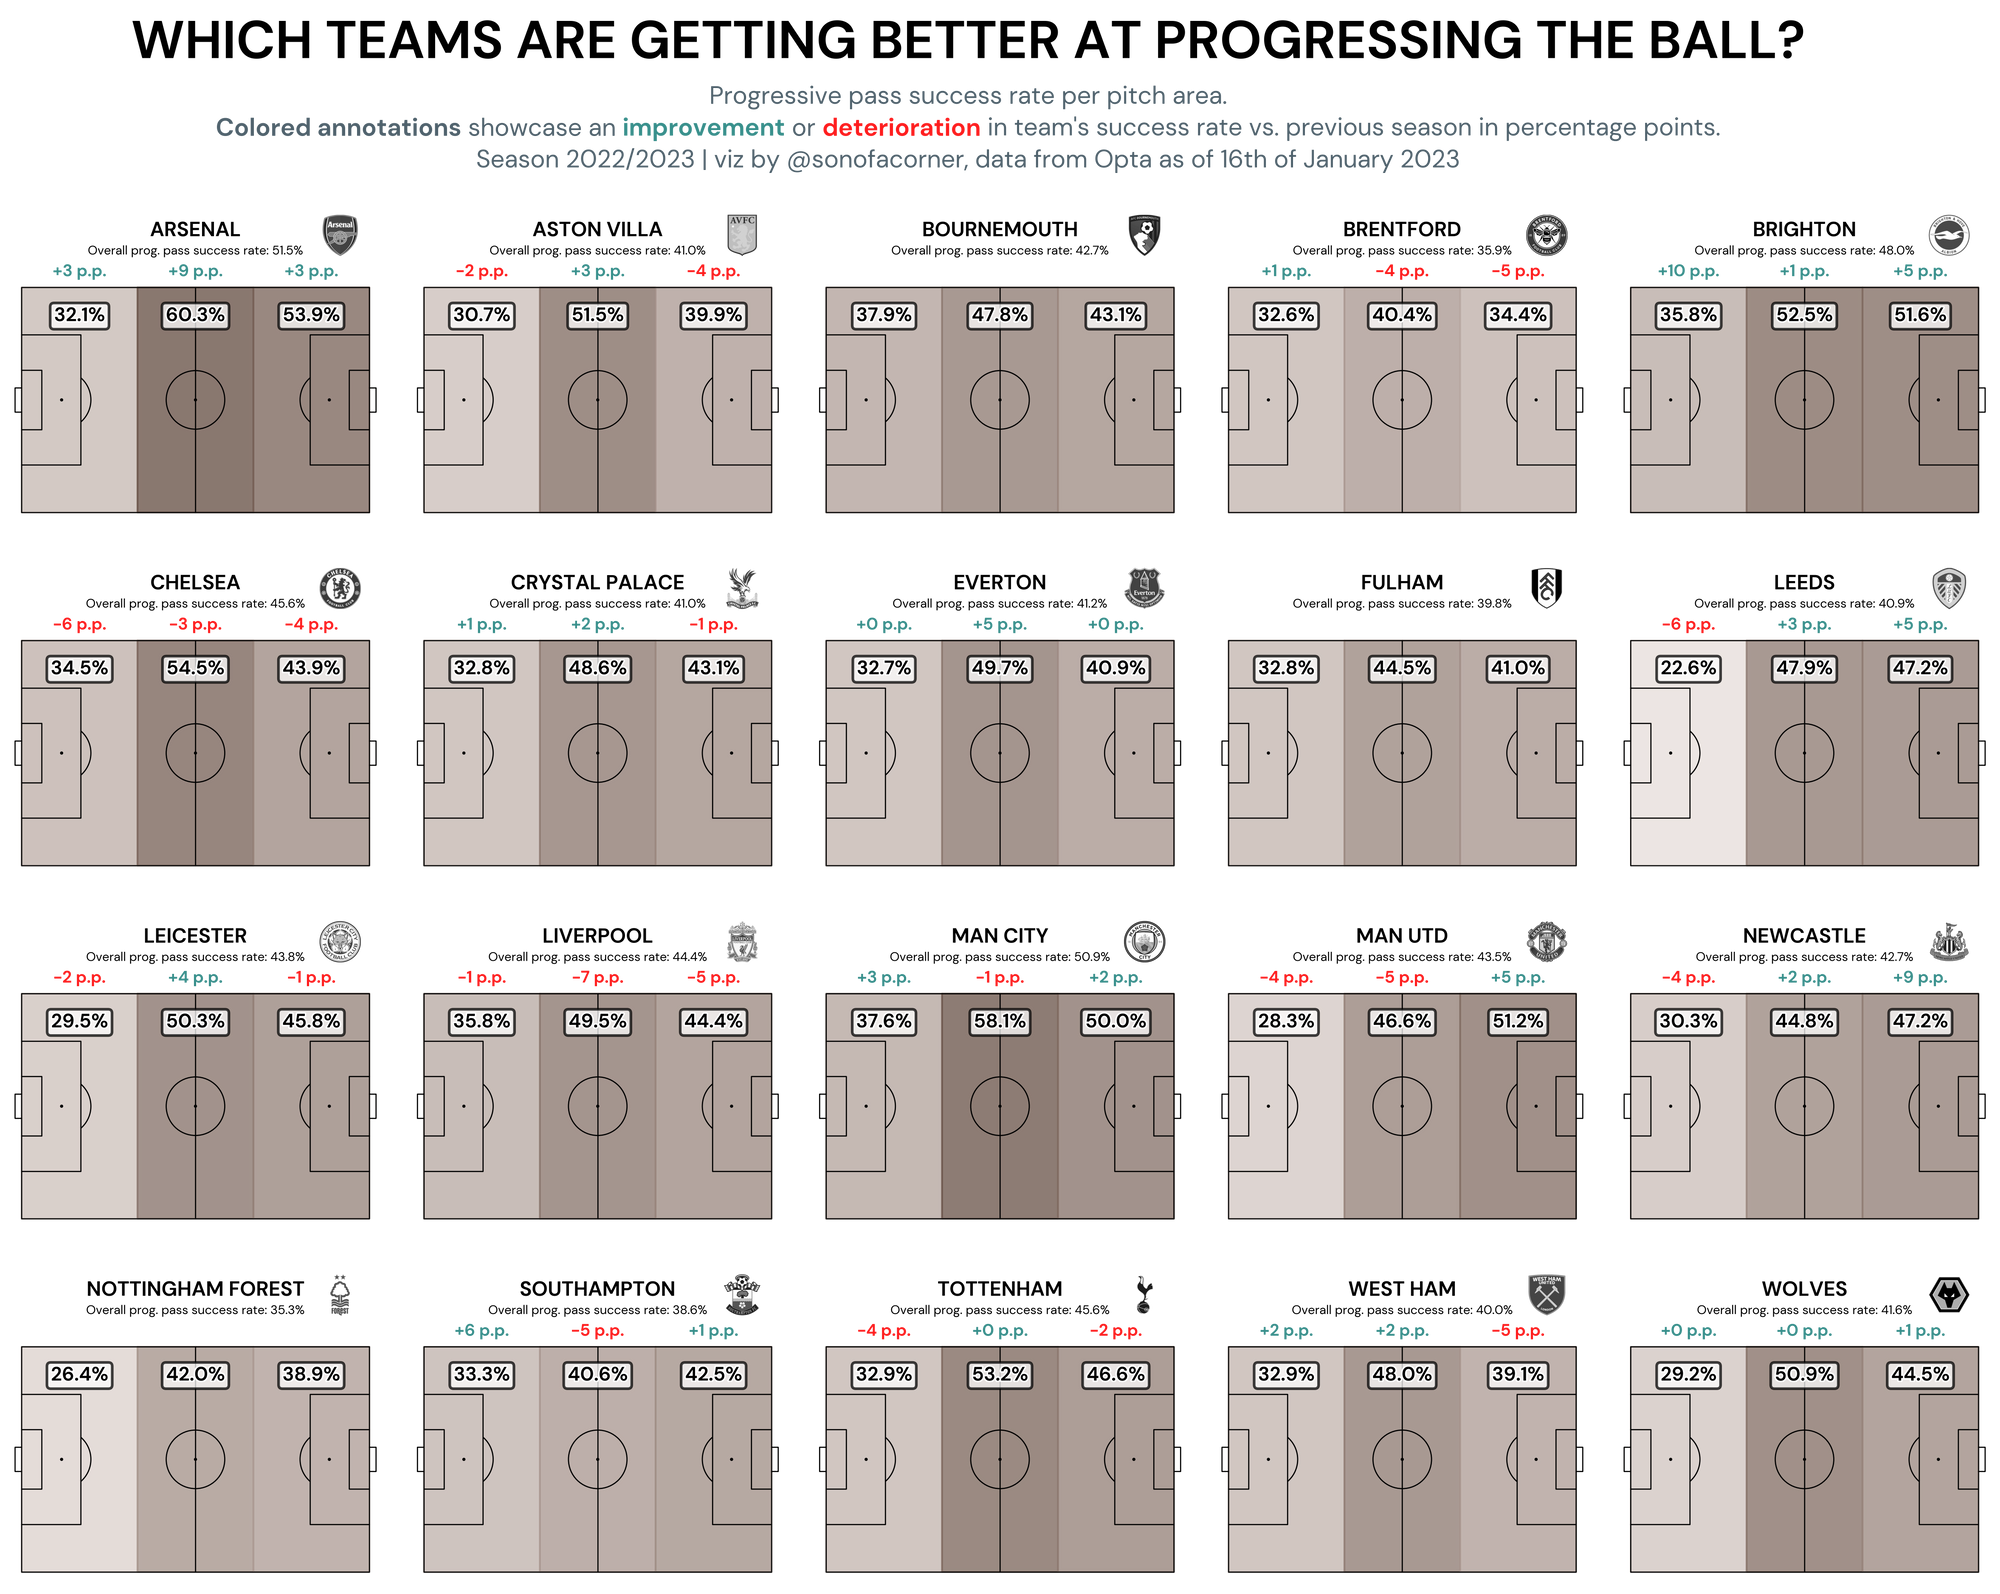
As you can see from the image above, the league's leaders have improved massively in their midfield progressive stats by taking their pass accuracy from 51% in the 2021/2022 season to 60% – that's an astounding increase of 9 percentage points, which places them at the top of ranking for this metric, and two percentage points above Man City (with a 58% success rate).
On the other hand, Liverpool have decreased their success rate in progressive passes by seven and five percentage points in the pitch's midfield and attacking areas, respectively.
Another key thing to note here is that Brighton have the third-highest overall progressive pass success rate in the league, just behind Arsenal and City – with De Zerbi's men improving significantly in their defensive progression accuracy stats by +10 percentage points!
From Around the Grounds
Jaymes Monte's Forward Types (WC viz)
This is a beautiful example of what can be achieved with StatsBomb's 360 data.
I've been playing around with some @StatsBomb 360 data to try and identify different types of forwards.
— Jaymes Monte (@ArabAnalytics) January 15, 2023
Can clearly see the differences between a Messi who likes to drop deep and receive the ball in space, versus a Giroud who will play on shoulder of last defender, for example. pic.twitter.com/Z1oj6iCA3x
Soumyajit Bose's Experimental Viz
Love how aesthetically pleasing this visual turned out!
Although the bar charts can be a bit confusing, and it might take a minute or two to take it in, this visual is a great example of how you can mix multiple types of charts to achieve beautiful results.
Recreating elements from this great work https://t.co/Ts7etW8JNH
— Soumyajit Bose (@Soumyaj15209314) January 13, 2023
for football pic.twitter.com/doPYpBmg6U
The code
I hope you enjoyed today's post. As always, you're welcome to take a look at my code and reproduce the visual.
If you get consistent value out of the site, consider becoming a paying member to support the improvement and content available on the website. I would really appreciate it!
All you need to do is check out my GitHub to get access to the notebook and the data behind it.