


Hi everyone!
Welcome to the 28th issue of the Viz of the Week newsletter, where I'll be featuring a new visual each week and sharing the code behind it.
If you haven't subscribed and wish to receive these posts straight to your inbox, subscribe to join the community and receive free updates!
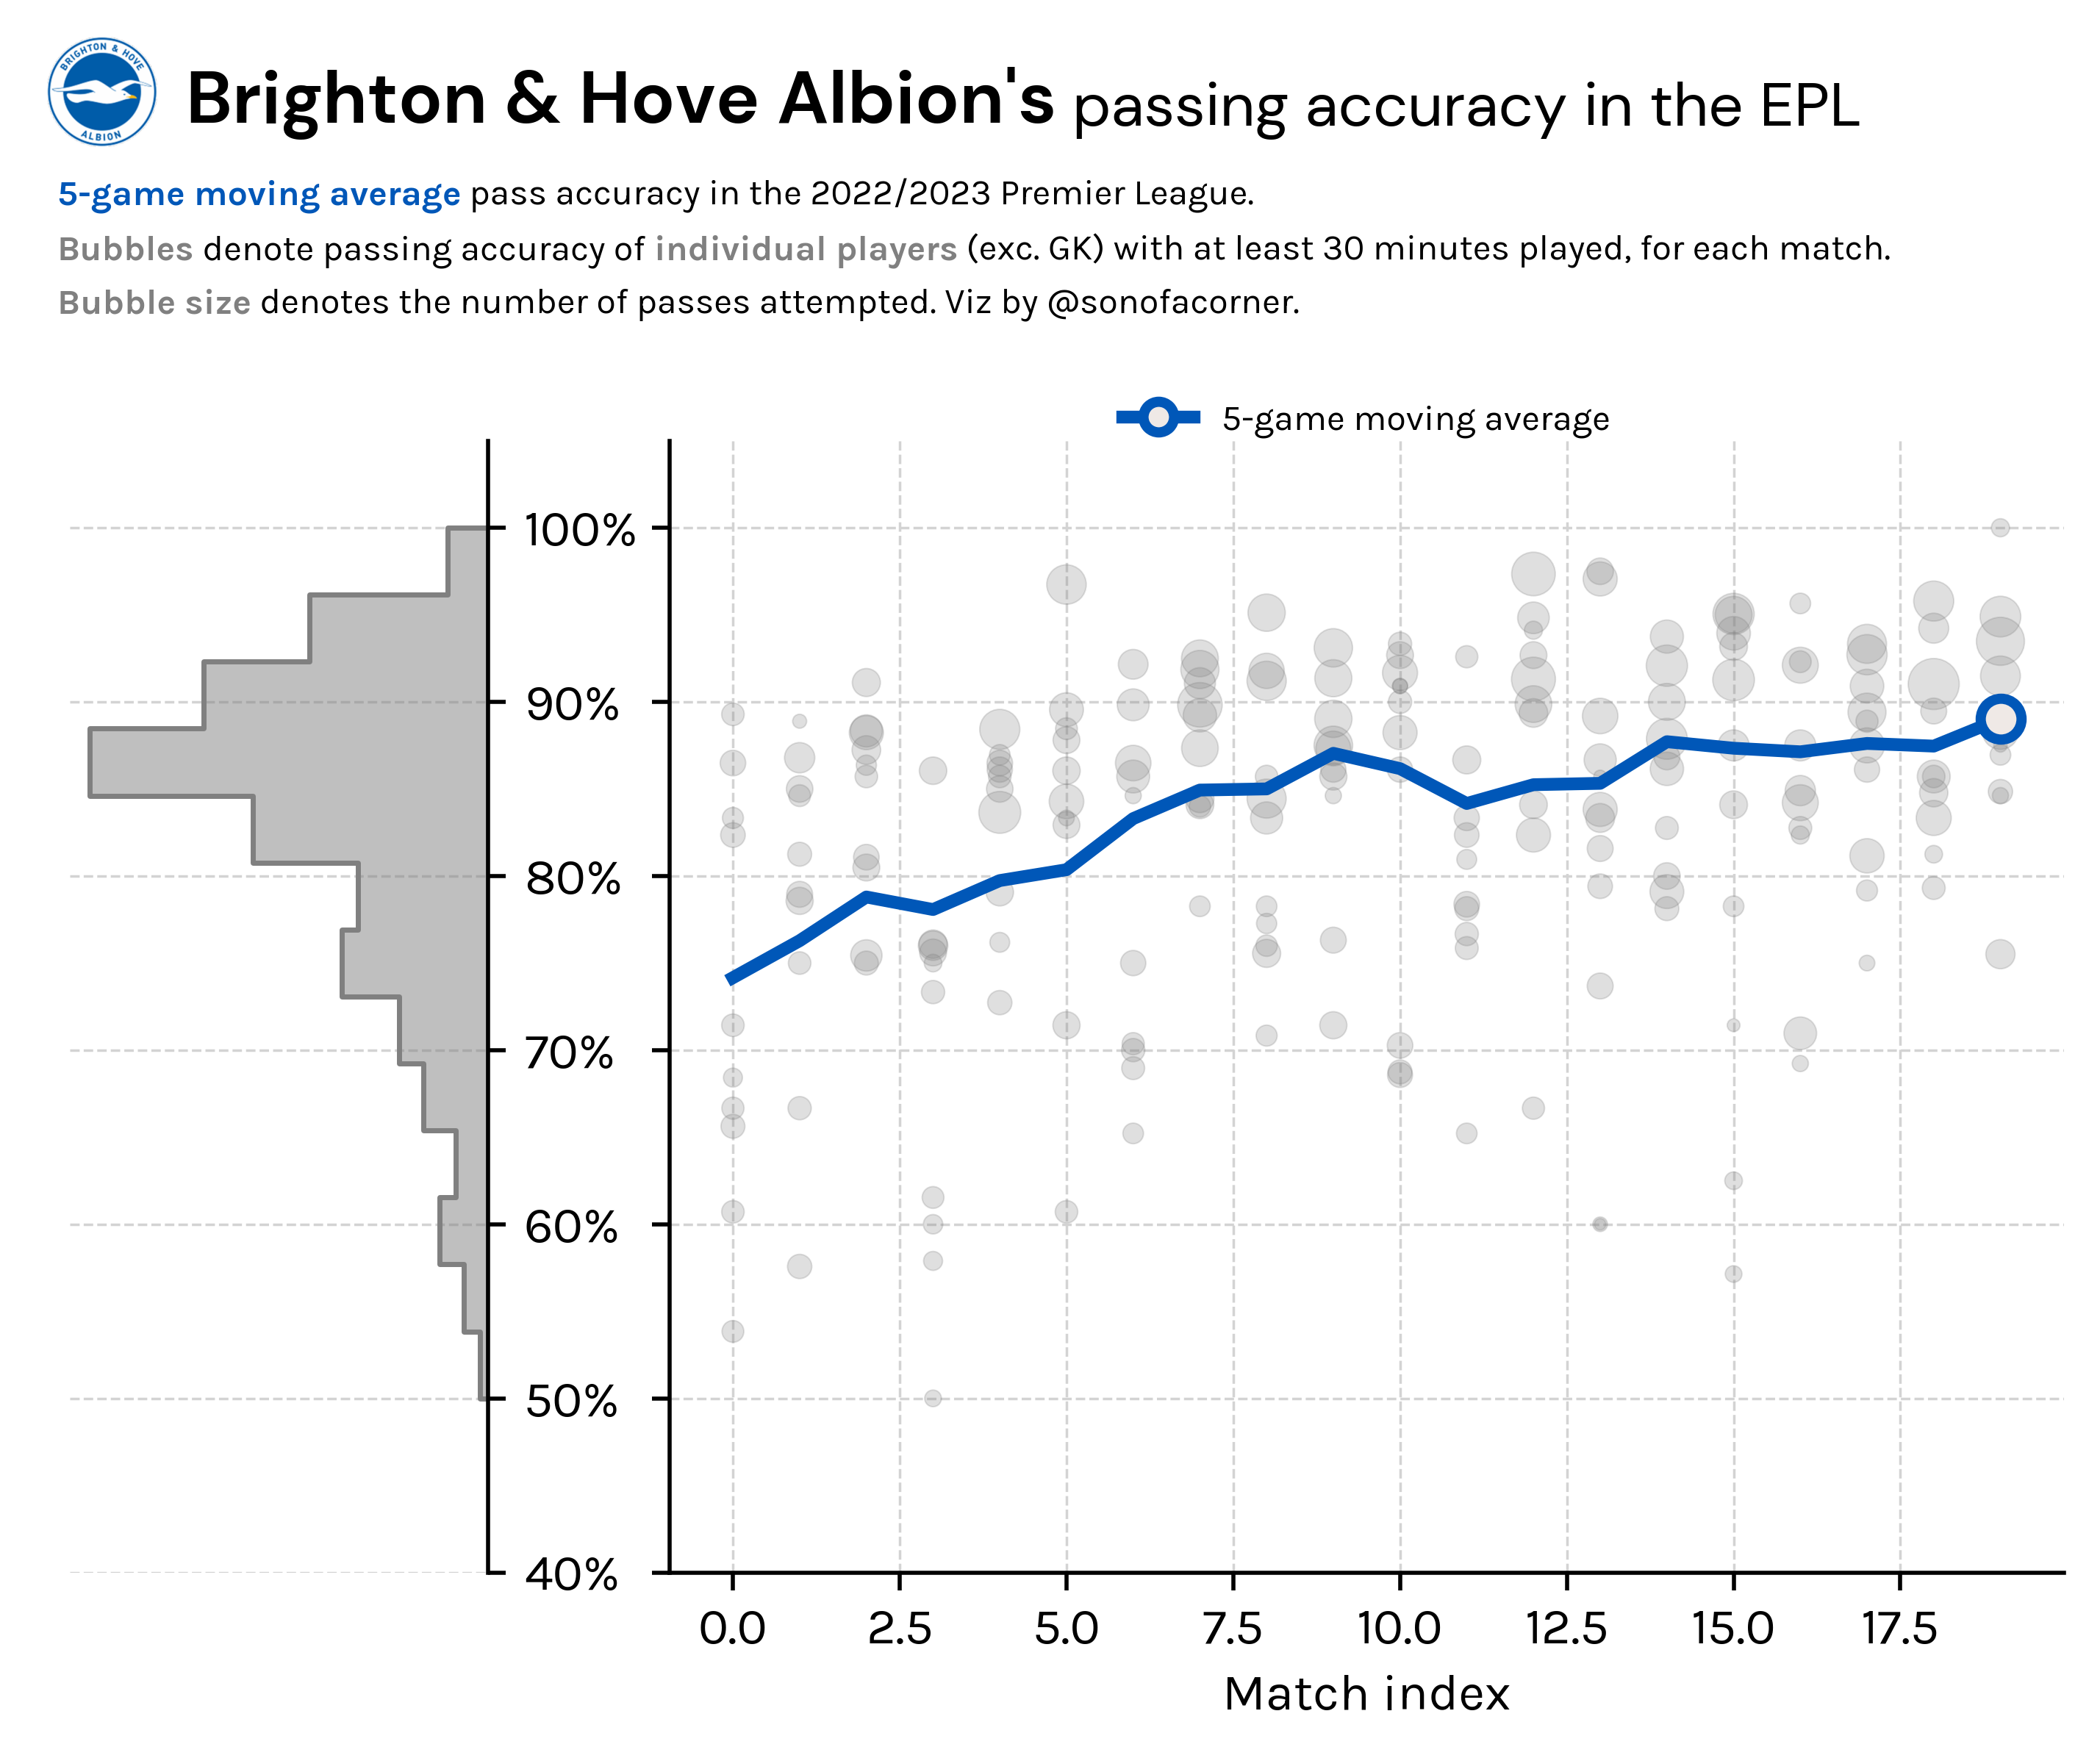
For this week, I wanted to do an experimental viz by trying to mix histograms, scatter plots, and line charts in a single plot.
The idea was to showcase how passing accuracy has trended for each team, plus the histogram of individual passing accuracy in a single graphic.
Here's the result with Brighton as an example.
The code
I hope you enjoyed today's post. As always, you're welcome to look at my code and reproduce the visual, the repo has data for all Premier League teams so you can visualize your favourite side!
All you need to do is check out my GitHub to get access to the notebook and the data behind it.
 sonofacorner