


Hi everyone!
Welcome to the 13th issue of the Viz of the Week newsletter, where I'll be featuring a new visual each week and sharing the code behind it.
I want to give a special welcome to the 28 new subscribers that joined this week. 🤍
If you haven't subscribed and wish to receive these posts straight to your inbox, subscribe to join the community and receive free updates!
This week I had my first encounter with event data, which I "scraped" from WhoScored.
To be honest, I just copy-pasted the data. That site is pretty difficult to scrape 🙃.
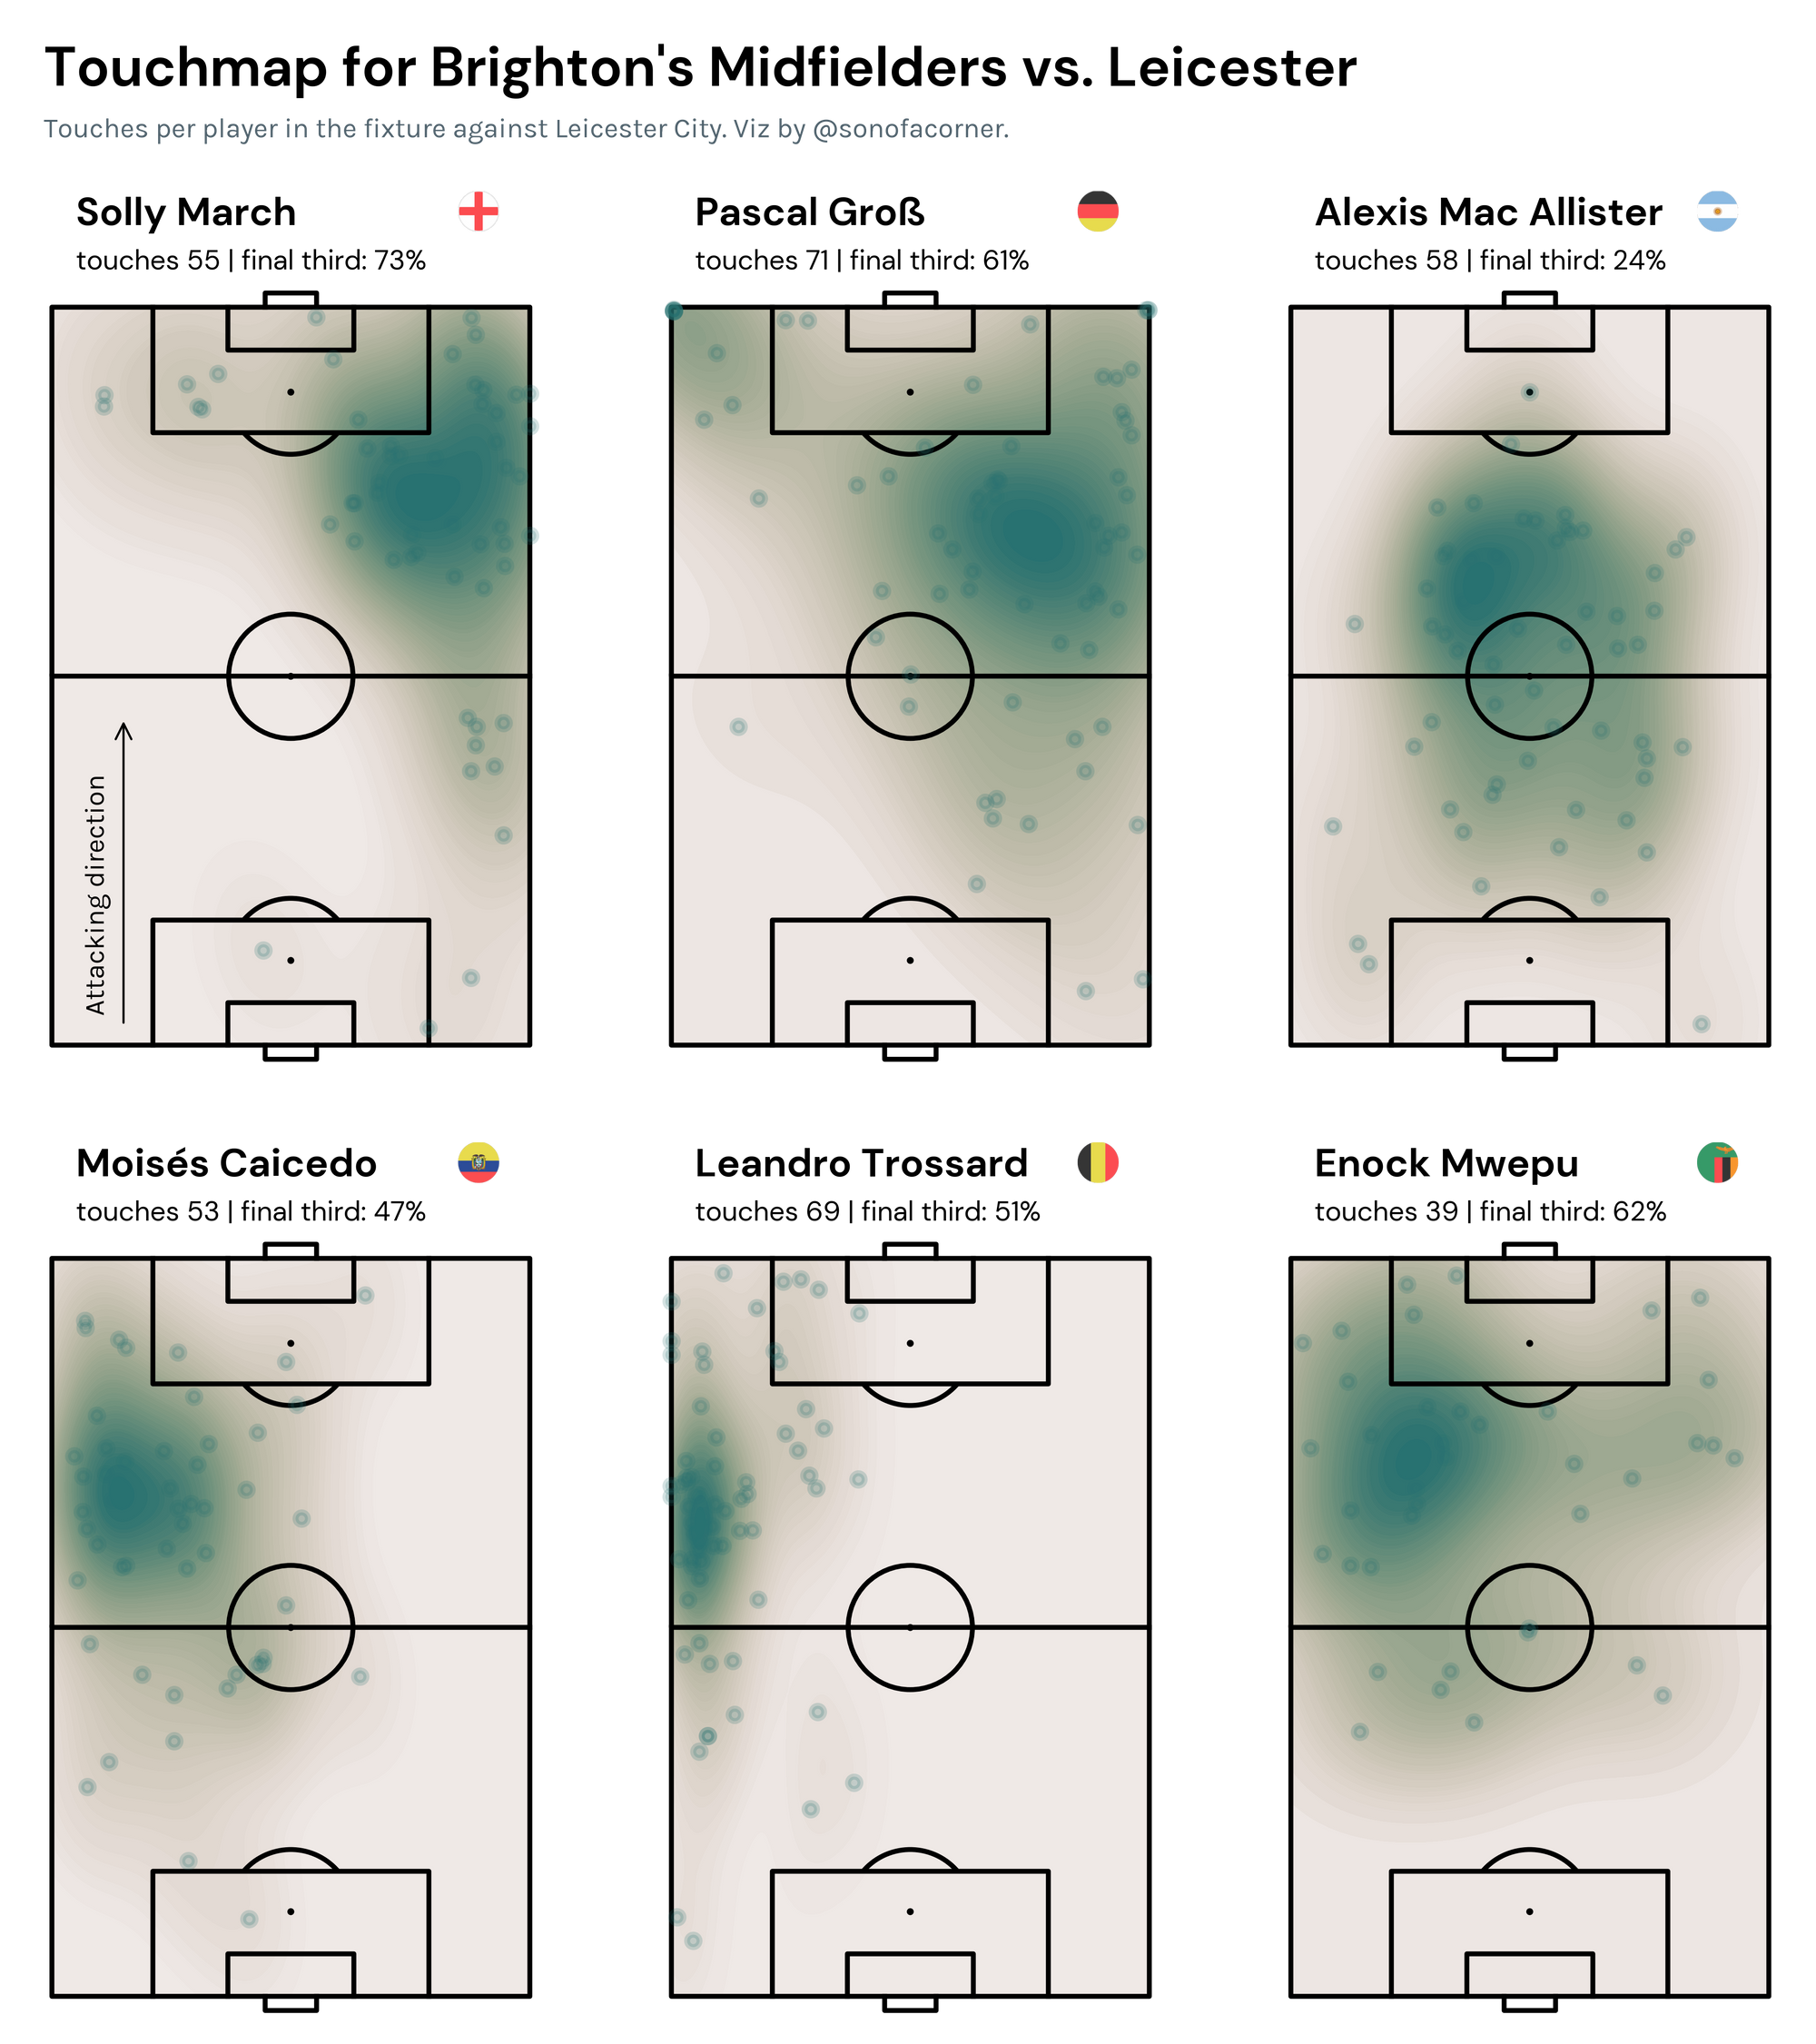
Brighton are becoming my favorite team this season, so I wanted to take a look at their midfielders' touches in the game against Leicester.
I love how the viz turned out, but I gotta give credit to the awesome mplsoccer package which did most of the heavy lifting.
From Around the Grounds
If you'd like to be featured in this section @ me on Twitter so I can see your work 😊.
Penalty blog's Massey Ratings visual
I recently discovered Martin's account, and it's pretty awesome.
His blog is full of helpful stuff on modeling, visualization, and other cool things. Be sure to check it out!
Massey Ratings are a way to account for strength of schedule in sport - here's what you get when you apply them to the Premier League so far pic.twitter.com/9BJ7xMXpj4
— Martin Eastwood (@penaltyblog) September 2, 2022
Lucas' Goalkeeper Template
This is why I made this website. I mean, look at that nice, clean and informative visual.
Really glad that the tutorials are helping people to create this amazing content.
I made these figures after reading @sonofacorner tutorials on @matplotlib and “Tiled shot maps”. They are 👌🏼 !!
— Lucas Lethuillier (@Mitsun0bu) August 31, 2022
I used data from @Wyscout in order to compare stats of two GKs from my hometown club : @RCSA ! In particular, I plot the % of goals conceded from each shot location. pic.twitter.com/L3onuahvXr
Ben Mayhew's Squad Retention Pie Charts
With the transfer window closed I've refreshed the squad retention graphics for the Premier League and EFL: https://t.co/GWi3Sz6579 pic.twitter.com/i3TEqsRJIp
— Ben Mayhew (@experimental361) September 2, 2022
The code
I hope you enjoyed today's post. As always, you're welcome to take a look at my code and reproduce the visual.
All you need to do is check out my GitHub to get access to the notebook and the data behind it.
If you enjoy these posts and charts, please help me by subscribing to my website and sharing my work.


