


Hi everyone!
Welcome to the 20th issue of the Viz of the Week newsletter, where I'll be featuring a new visual each week and sharing the code behind it.
I want to give a special welcome to the 14 new subscribers that joined this week. 🤍
If you haven't subscribed and wish to receive these posts straight to your inbox, subscribe to join the community and receive free updates!
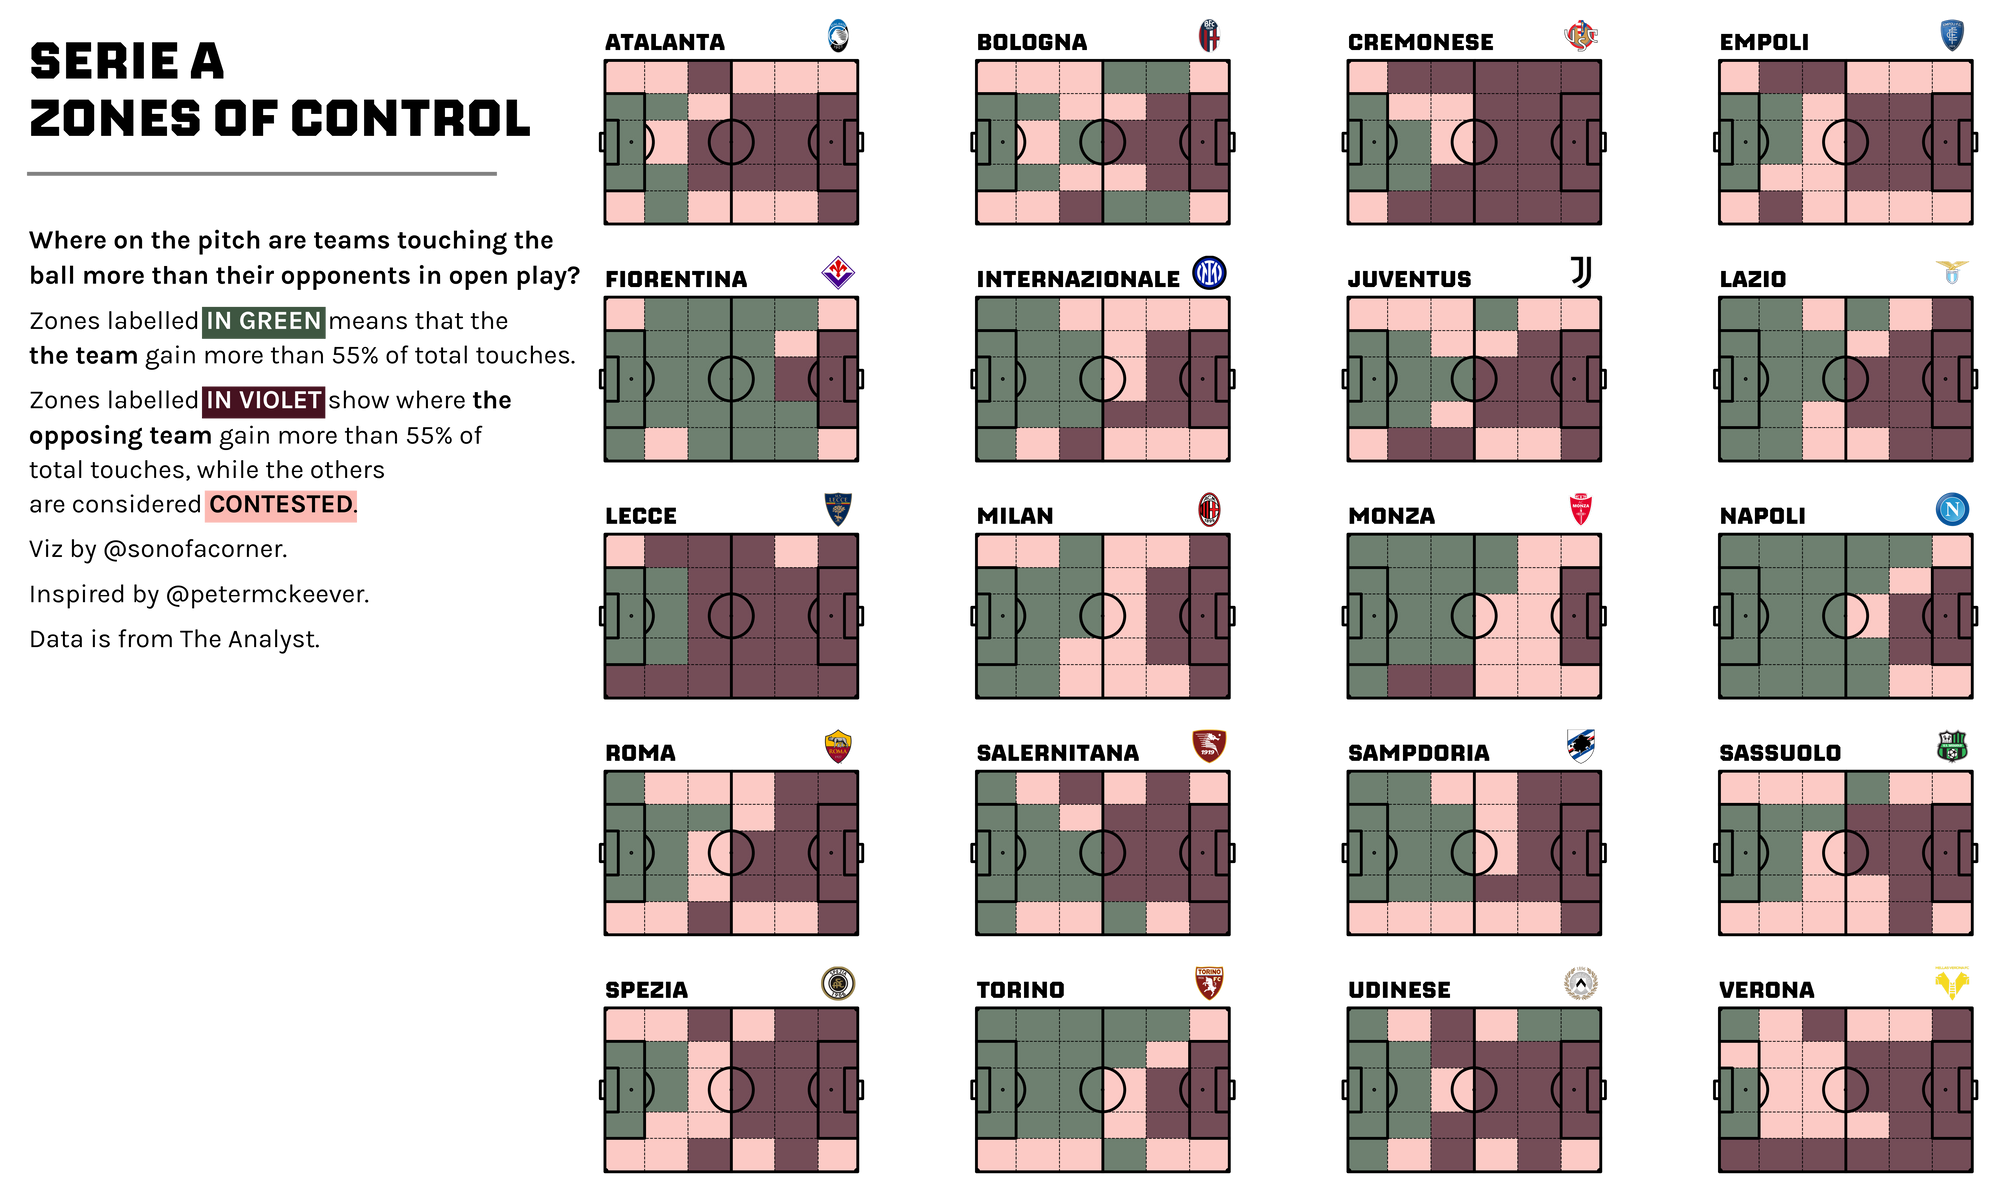
This week the inspiration comes from Peter McKeever's amazing visual on contested zones from The Analyst.
In his viz, Peter looks at the zones of the pitch where teams have the most (or least) share of touches to elegantly present which are the areas that are most contested or dominated by a given side.
I really enjoyed this one.
From Around the Grounds
Here are some of the cool things I saw from the community on Twitter this past week 😀
Shot Efficiency by Sezer Unar
Sezer has some awesome visuals, and although this one is a bit hard to read, I wanted to showcase the man's amazing attention to detail and his creative design.
It really catches the eye and gives way to inspire others to be open to experimentation.
🚨⚽️ Experimental viz
— Sezer Unar (@unarsezer) October 19, 2022
I was wondering if I could show 4 dimensions on the same scatter plot. This would be possible by dividing the panel area in half, but the metric on the x-axis should cover the metric on the y-axis.
The output looks like a seashell. pic.twitter.com/ETbkjfK7z0
Shot Efficiency by Ankur
Those colors and title font make this viz so incredibly elegant 😍.
Most clinical finishers across Europe's big 5 domestic leagues during the 2021/22 season. [Data from fbref]
— Ankur (@imnotAnkur) October 22, 2022
Created with thanks to @sonofacorner's code for xGOT - xG chart in the Swiss league. pic.twitter.com/buIKHBw4GV
@danzn1 mpltable library
Daniel is the creator of the very popular highlight-text package and he has now released an early version of a library to simplify table creation in matplotlib.
I haven't had the chance to test it yet, but I'm sure it's awesome. If you have time, play around with it and give the man some feedback!
I released an early version of mpltable, for now available only through GitHub:https://t.co/FTvI2CQVMM
— danzn1 (@danzn1) October 13, 2022
I you care to try it out, any and all feedback, suggestions (no holding back!) and help would be much appreciated.
The code
I hope you enjoyed today's post. As always, you're welcome to take a look at my code and reproduce the visual.
If you get consistent value out of the site, consider becoming a paying member to support the improvement and content available on the website. I would really appreciate it!
All you need to do is check out my GitHub to get access to the notebook and the data behind it.
If you're already a member, I really have my tail between my legs here and I apologize for the delay on the exclusive member newsletter and GitHub repo. My work has been tough this past couple of weeks and I'm trying my best to give you something of value for your contributions. Please be patient with me as I set things up.


