


Hi everyone!
Welcome to the twelfth issue of the Viz of the Week newsletter, where I'll be featuring a new visual each week and sharing the code behind it.
It's been three months since I started this newsletter, and I want to give a special welcome to the 37 new subscribers that joined this week. 🤍
If you haven't subscribed and wish to receive these posts straight to your inbox, subscribe to join the community and receive free updates!
This week I iterated over the shot heatmap I posted a while ago for my striker template visual.
Took feedback on my striker template.
— Son of a corner (@sonofacorner) July 17, 2022
Here are the results 👇
First up, Dominic Solanke 🍒
Thread with some Championship strikers 🧵 pic.twitter.com/rvN4RqUMAh
After receiving some suggestions, and using most of the code from my Tiled Shots Maps tutorial, I redesigned the bins that show the areas of the pitch where teams (or players) take their shots.
Here's the result using data from the Jupiler Pro League.
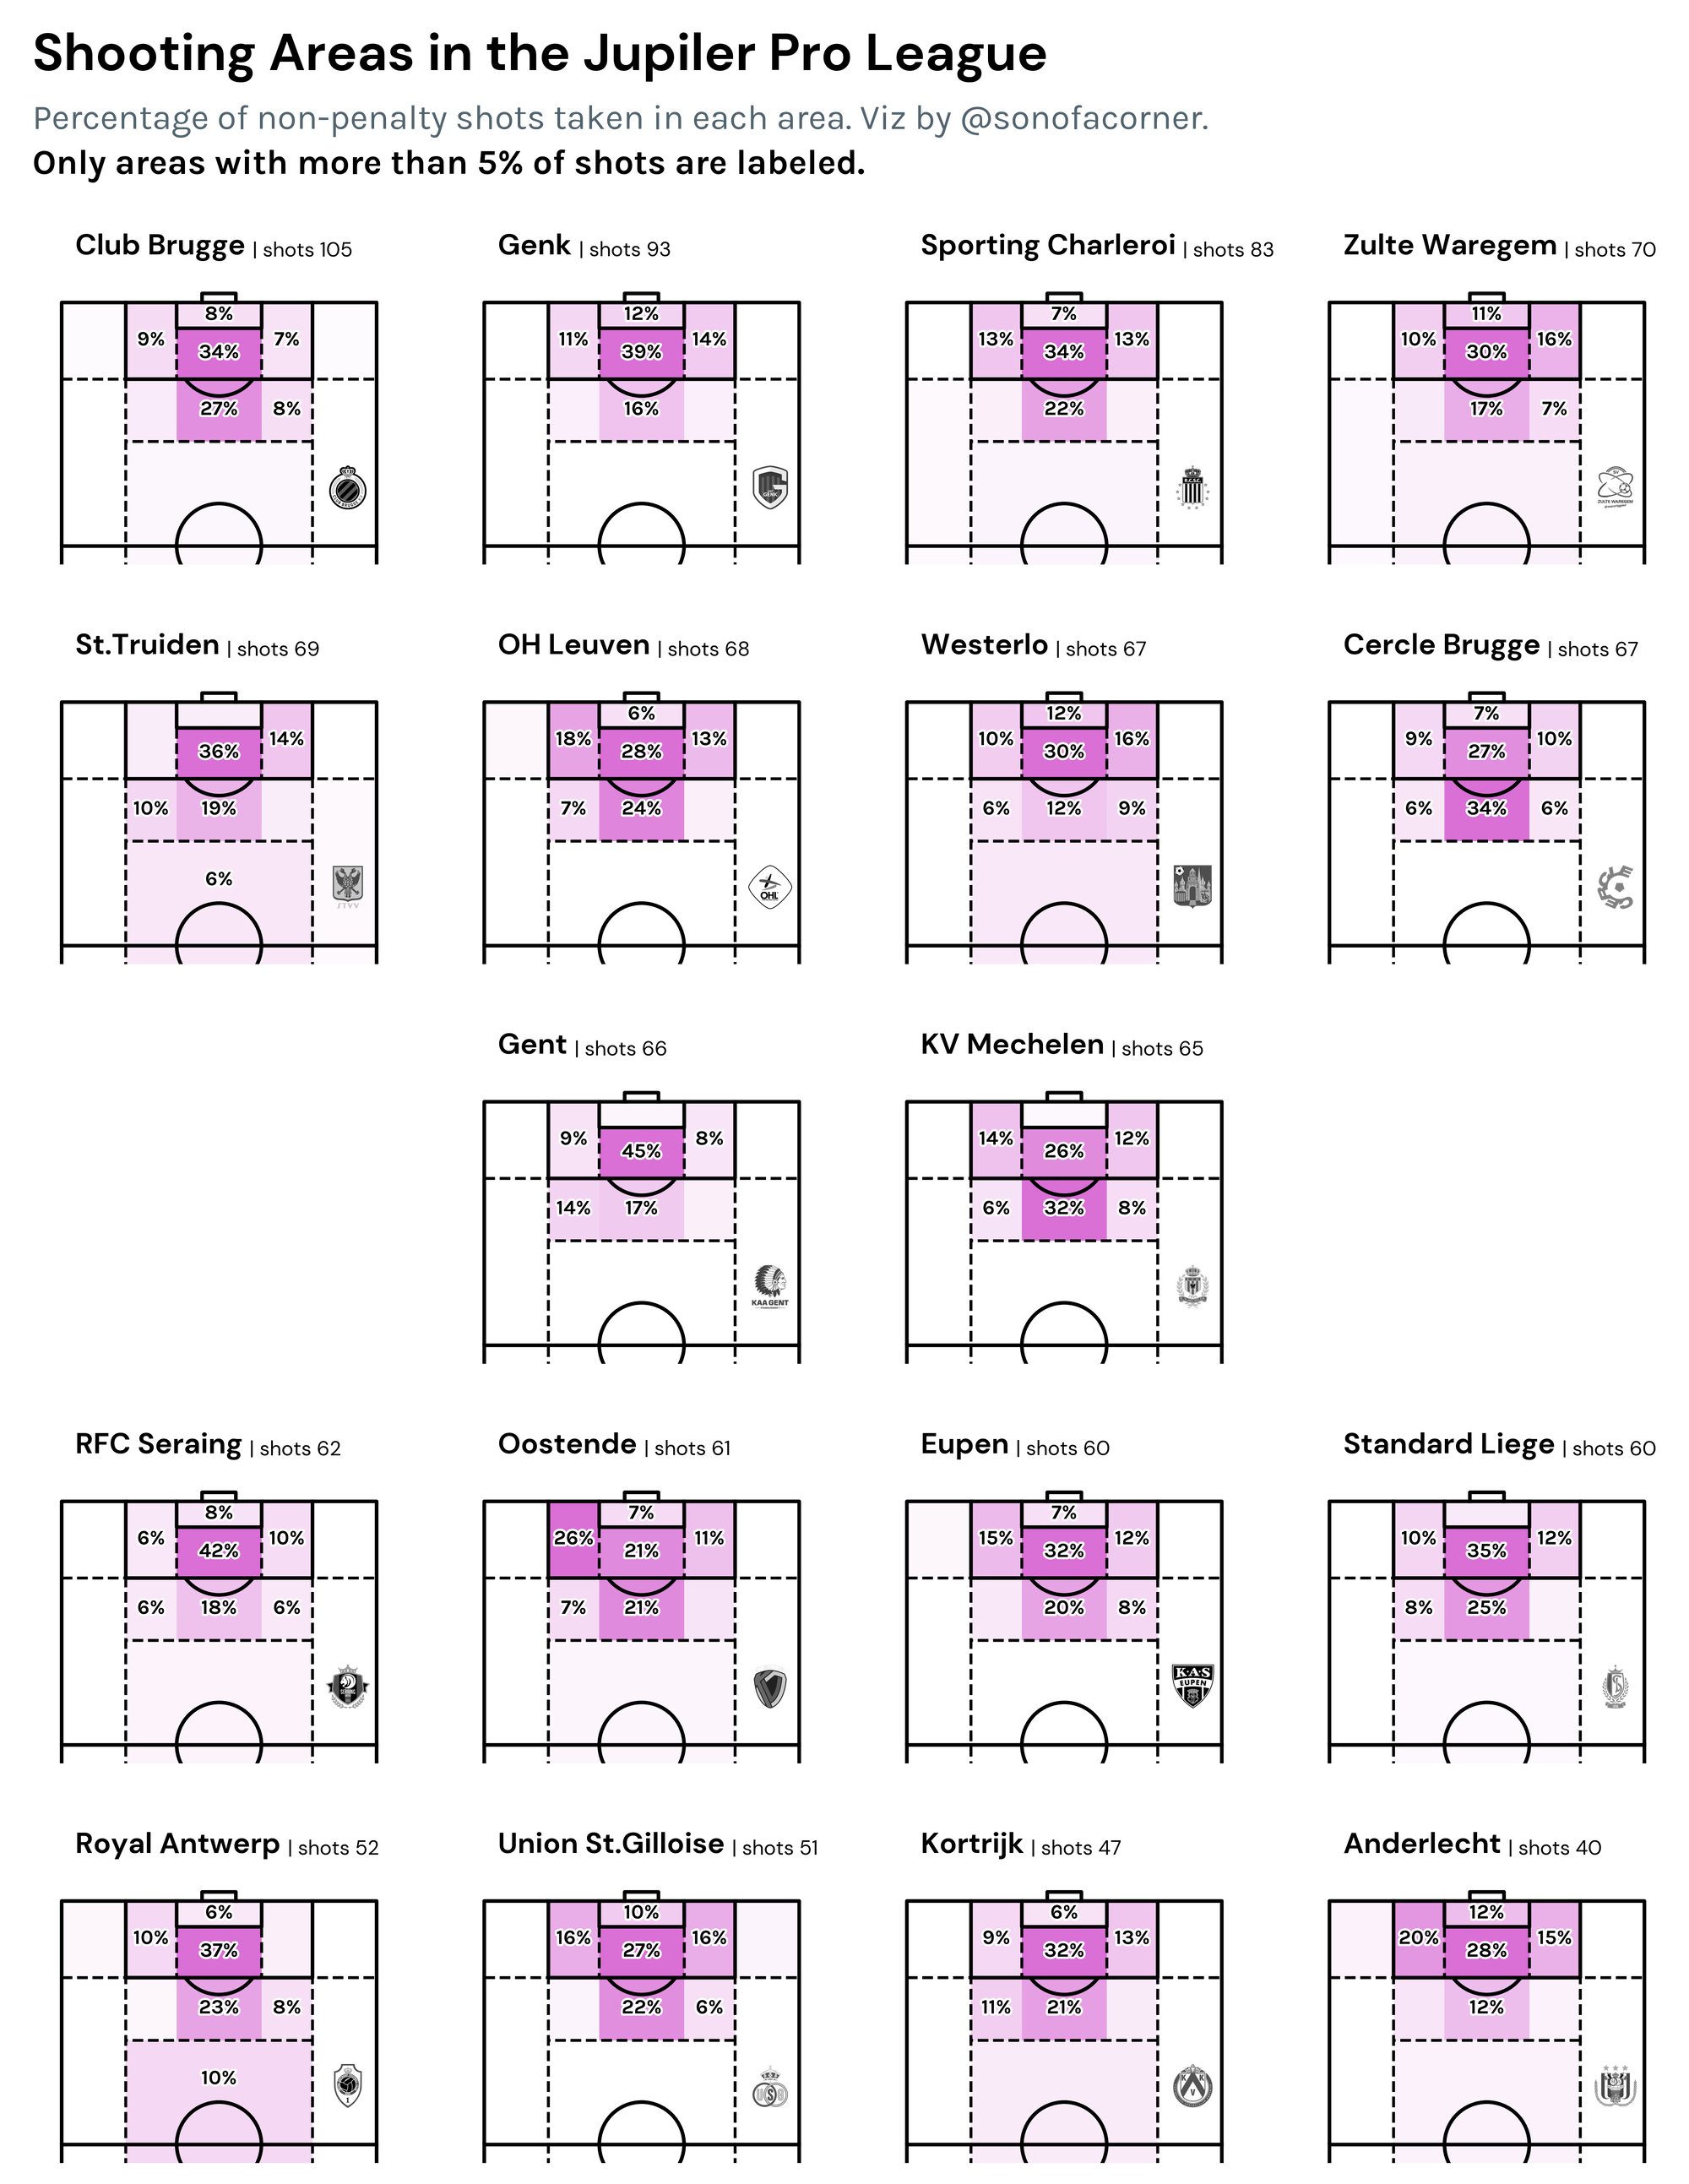
What do you think?
From Around the Grounds
I recently added a new section to the newsletter where I highlight visuals or articles that caught my attention during the week, if you'd like to be featured @ me on Twitter so I can see your work 😊.
Soumyajit's 3D Transforms Tutorial
An amazing tutorial from Soumyajit on how to create these types of visuals using matplotlib.
Really enjoyed reading the "brief rant" section at the end of the post...don't miss it.
Want to create stuff like this ? Here is a tutorial https://t.co/cnVYrF4N5F pic.twitter.com/XFNHyvFweX
— Soumyajit Bose (@Soumyaj15209314) July 27, 2022
End Positions of Team Crosses by Stuart Macfarlane
Love the design of this one...
Very nice 👏 https://t.co/UorhPWUgbL
— Son of a corner (@sonofacorner) August 25, 2022
Average Location of Passes into the Penalty Box by @nrehiew
📊Inspired by @OptaAnalyst and @maramperninety, I looked at how PL teams attack the opposing penalty box
— nrehiew (@nrehiew) June 6, 2022
- United are the narrowest team
- Burnley attack the far post on both flanks
- Multiple teams attacking the half-space
As always, feedback, likes and RTs are welcome!😀 pic.twitter.com/mp2JAKEFhP
The code
I hope you enjoyed today's post. As always, you're welcome to take a look at my code and reproduce the visual.
All you need to do is check out my GitHub to get access to the notebook and the data behind it.
If you enjoy these posts and charts, please help me by subscribing to my website and sharing my work.


