


Hi everyone!
Welcome to the 18th issue of the Viz of the Week newsletter, where I'll be featuring a new visual each week and sharing the code behind it.
I want to give a special welcome to the 32 new subscribers that joined this week. 🤍
If you haven't subscribed and wish to receive these posts straight to your inbox, subscribe to join the community and receive free updates!
I'm kind of in love with line charts at the moment.
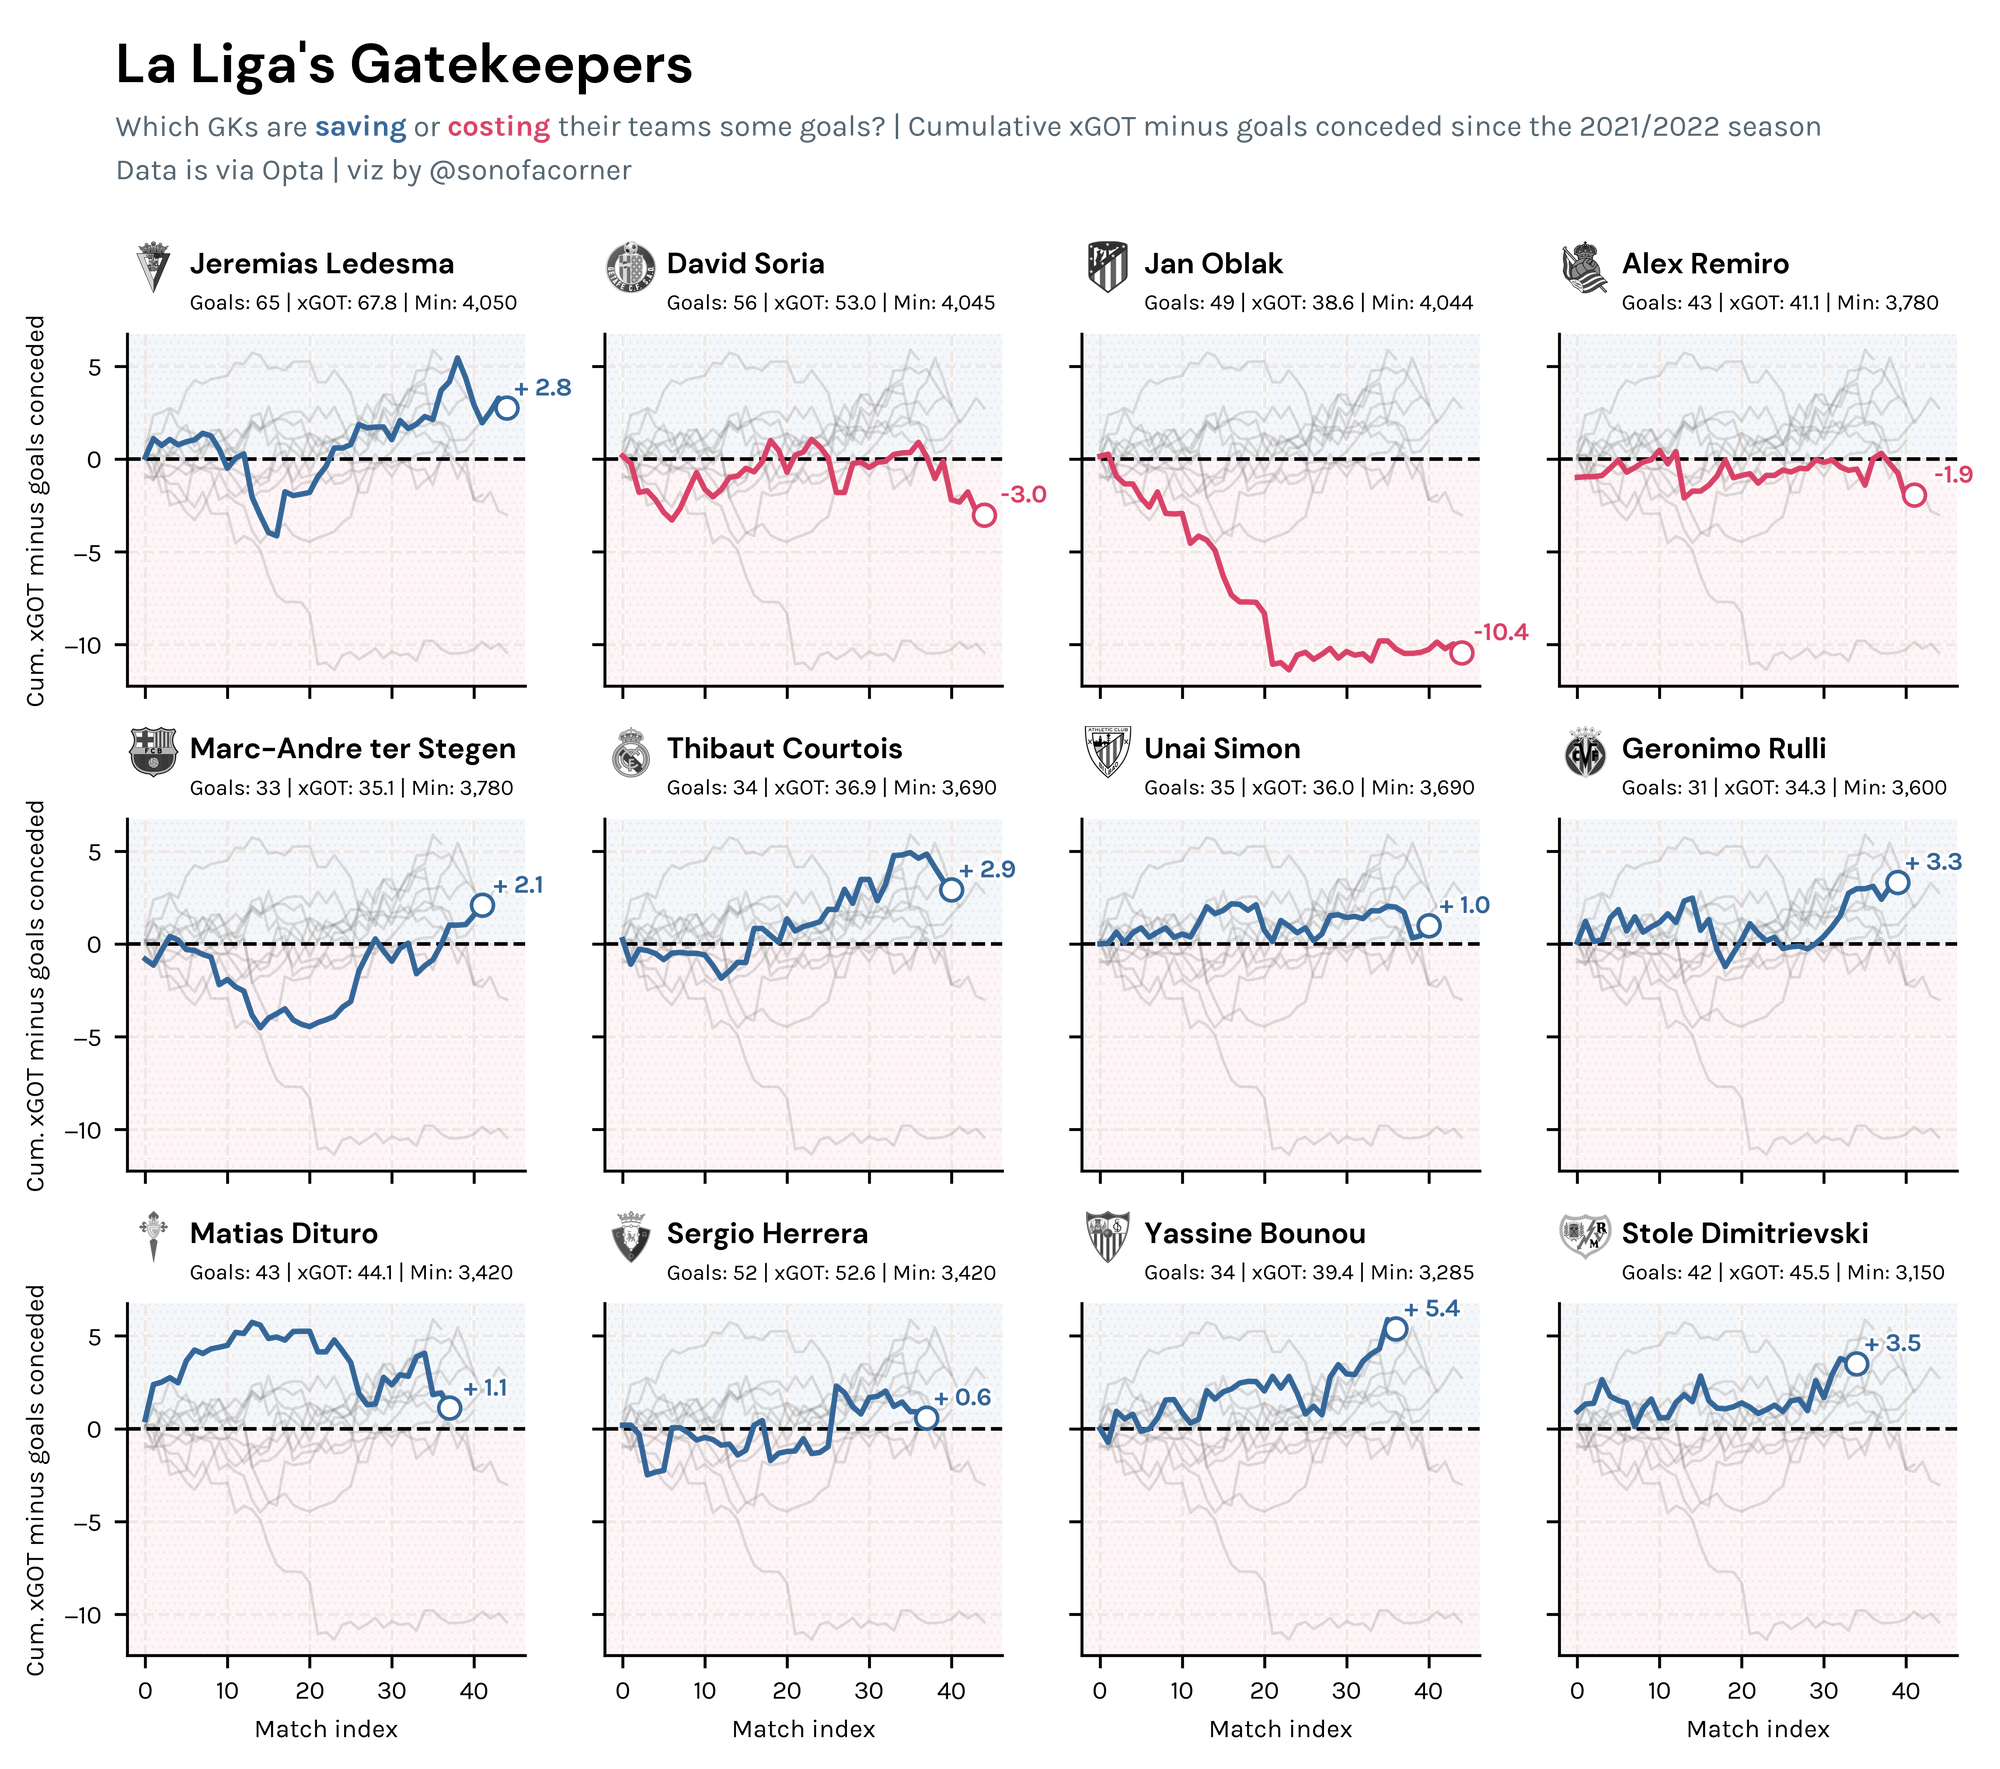
This week I wanted to take a look at which goalkeepers in La Liga have been saving or conceding more goals than expected. Although this is not a perfect way to evaluate goalkeepers, it's still a useful exercise and one which – at least for La Liga – showed some surprising results.
Wow, right?
I would have never guessed for Jan Oblak to rank so low, I even thought that I was making a mistake. But no, those are his actual figures, at least according to Opta's model.
From Around the Grounds
Here are some of the cool things I saw from the community on Twitter this past week 😀
Estimated Impact by Edvin
A beautiful web application with a new metric called "Estimated Impact".
This is amazing analytical work and has some beautiful visuals too!
After two months of work, I'm excited to share a new player metric with you!
— Edvin (@Edvin_TH) October 7, 2022
Estimated Impact is an all-in-one player metric that uses multiple components to estimate a player's true impact and effectiveness.
Explore the metric with this web app:https://t.co/zsqrjvc8ej pic.twitter.com/UTQZk2oAlA
Haaland: Data Viz Special by The Analyst
Great visual presentation of how Haaland is just a man from a different planet.
Seems that the visuals are all made in Javascript's D3. Learning D3 is definitely on my bucket list.
𝐄𝐫𝐥𝐢𝐧𝐠 𝐇𝐚𝐚𝐥𝐚𝐧𝐝: 𝐃𝐚𝐭𝐚 𝐕𝐢𝐳 𝐒𝐩𝐞𝐜𝐢𝐚𝐥 📈
— The Analyst (@OptaAnalyst) October 10, 2022
Erling Haaland's already scored 20 goals for Manchester City, but what else do you need to know about his record-breaking start to life at #MCFC?
Our data viz king @petermckeever's done all the work for you. ⬇️
The code
I hope you enjoyed today's post. As always, you're welcome to take a look at my code and reproduce the visual.
If you get consistent value out of the site, consider becoming a paying member to support the improvement and content available on the website. I would really appreciate it!
All you need to do is check out my GitHub to get access to the notebook and the data behind it.


