


Hi everyone!
Welcome to the 15th issue of the Viz of the Week newsletter, where I'll be featuring a new visual each week and sharing the code behind it.
I want to give a special welcome to the 17 new subscribers that joined this week. 🤍
If you haven't subscribed and wish to receive these posts straight to your inbox, subscribe to join the community and receive free updates!
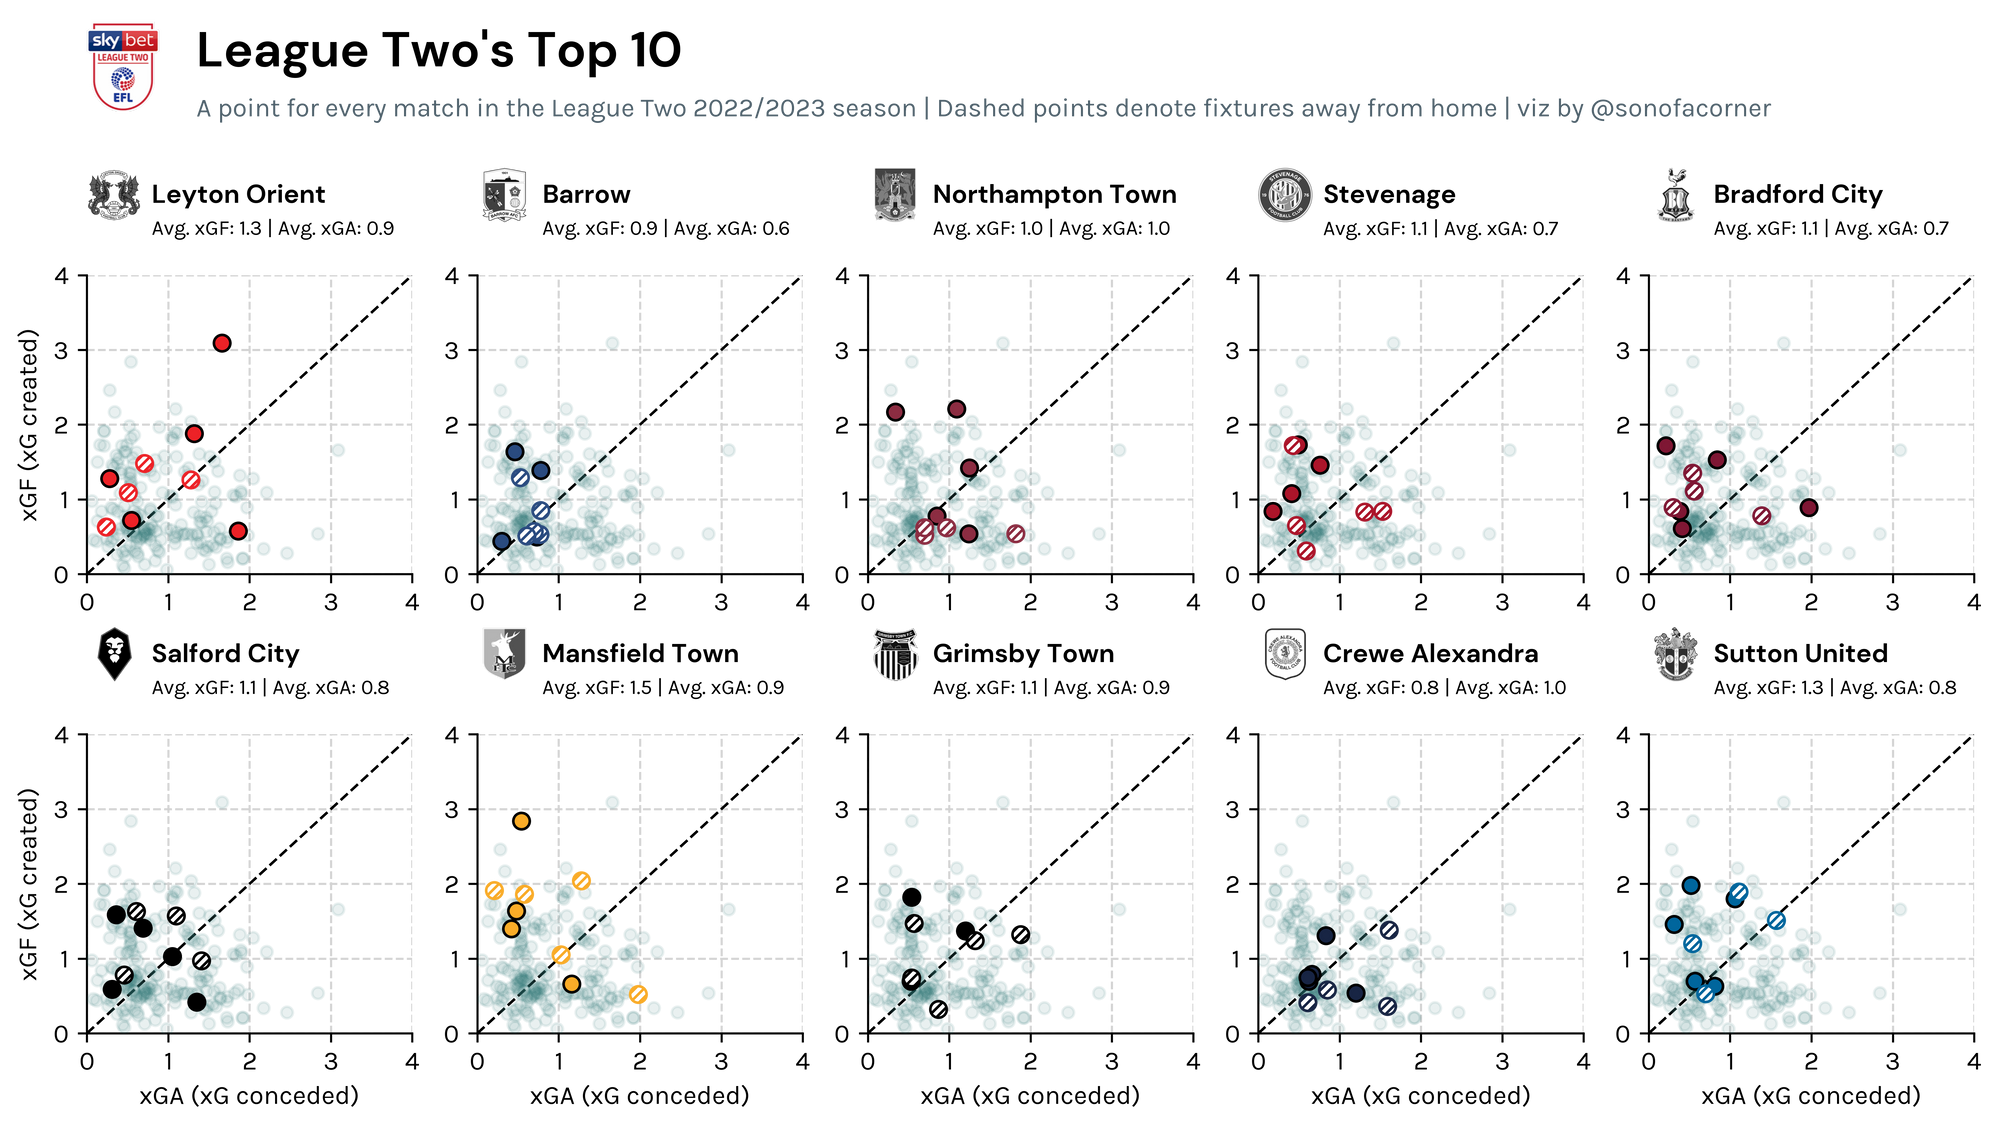
This week I'll be pulling one from the archives, where I look at xG created and conceded in the form of a scatter plot, only this time I do it for League Two teams.
The Premier League top of the table, an xG scatter plot. 📊
— Son of a corner (@sonofacorner) May 24, 2022
City never conceded more chances than they created. Not once.
Arsenal & United really struggled to contain top 6 opposition -- only in 3/10 did they create more chances than they conceded.
I'm gonna miss the EPL 😥 pic.twitter.com/CqfXzucORY
Since I never really published the code behind this visual, I thought it was time to give insight into how this is done. Hope you enjoy it!
From Around the Grounds
If you'd like to be featured in this section @ me on Twitter so I can see your work 😊.
Substitution Timings in the EPL by @FPL_Spaceman
I really loved how elegant this viz turned out.
This might only be useful for FPL players, but nonetheless, it gives a lot of inspiration for what other things could be done with this layout, such as the timing of shots and corners.
Is anyone willing to give it a shot?
Substitution timings for all 20 #PremierLeague clubs so far this season 🔄
— JC 🚀 (@FPL_Spaceman) September 11, 2022
Special #FPL shout-out to Arteta, Potter and Howe for no pre-60' subs 🙌
🎨 @FPL_Spaceman & @FPL_Chase
📊 @sertalpbilal via @premierleague pic.twitter.com/O1oJHron8x
Hexbin of Shots Conceded from Open Play by @FPL_Chase
This is one I had in the archives for quite a while, but I love the way that Chase uses hex bins to group the location of open play shots.
Plus, that pink color is just amazing.
Just for illustration, this is how EPL teams fared in allowing/suppressing opposition open play shots in the first 6 GWs.
— Chase (@FPL_Chase) September 5, 2022
The number under each subplot is open play xG conceded per game.
⚠️All the typical small sample caveats apply pic.twitter.com/mPTVcVgf8P
xG Lollipops in R by @unarsezer
Sezer Unar is a master at creating beautiful visualizations, and the best thing about it is that he just recently started sharing his code.
The only "downside" is that it's done in R 🤢 (just kidding).
He has an amazing template for xG lollipop charts and you can now learn from it to create your own.
🚨⚽️📊 Ladies and gentlemen, please welcome the codes for the xG lollipop chart.#ggplot2 https://t.co/HTGBY56Ckb
— Sezer Unar (@unarsezer) September 15, 2022
The code
I hope you enjoyed today's post. As always, you're welcome to take a look at my code and reproduce the visual.
All you need to do is check out my GitHub to get access to the notebook and the data behind it.
If you enjoy these posts and charts, please help me by subscribing to my website and sharing my work.


