


Hi everyone!
Welcome to the 22nd issue of the Viz of the Week newsletter, where I'll be featuring a new visual each week and sharing the code behind it.
I want to give a special welcome to the 25 new subscribers that joined this week. 🤍
If you haven't subscribed and wish to receive these posts straight to your inbox, subscribe to join the community and receive free updates!
After watching the Spurs - Liverpool game this week I was curious about how Eric Dier ranked amongst Premier League players, regarding the number of long balls attempted and his success rate.
So I decided to check the stats and use them for today's visual. Plus, it was a good excuse to finally use the adjust_text package.
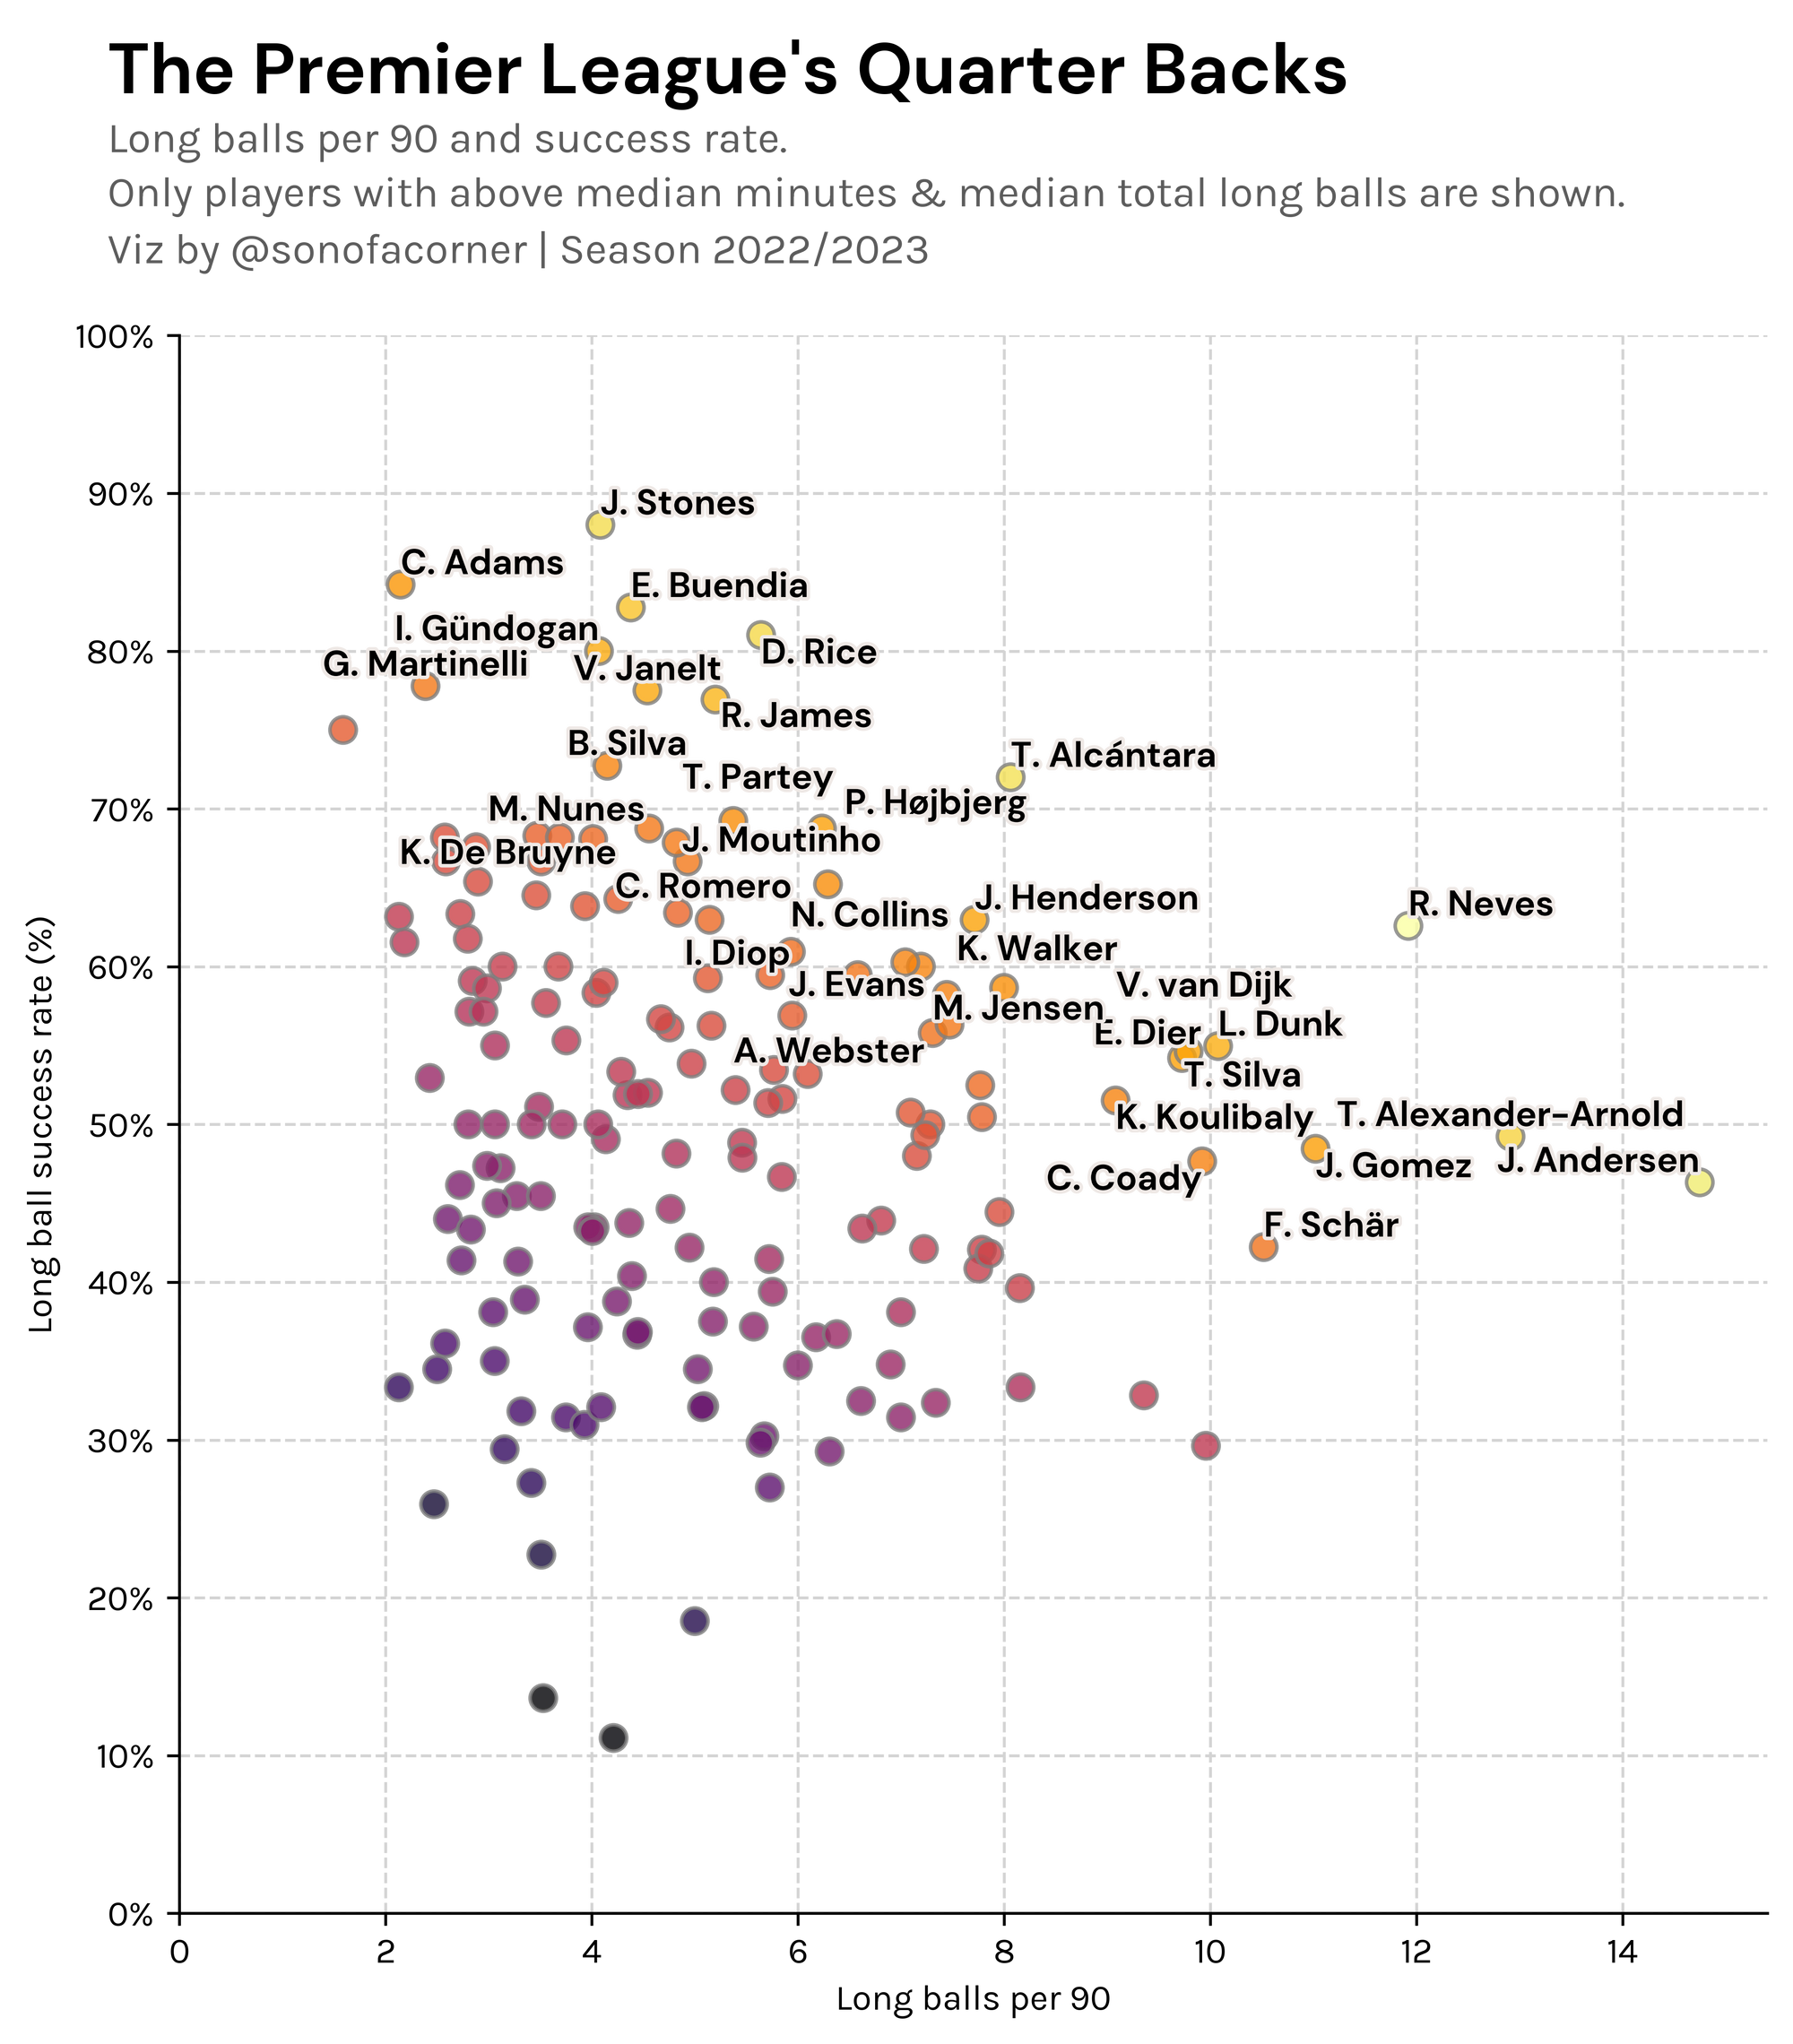
So there you have it, Eric Dier tries close to 10 long balls per 90, and has a success rate close to 55%. Honestly, I would've thought he would be positioned higher on the x-axis and lower on the y-axis.
From Around the Grounds
Here are some of the cool things I saw from the community on Twitter this past week 😀
Patrick Caskie's - UEL Attacking Threat
The UEL Group Stage saw a nice mix of established names and obscure ones take centre stage. Despite the overwhelming top-5 league representation, there are still plenty of exciting names to monitor, like Kady and Emegha. pic.twitter.com/FUyGHv3aFx
— Patrick Caskie (@patrickcaskie) November 4, 2022
Enrique's Premier League pass networks
English Premier League | Season 22/23
— Enrique🇲🇽 (@egudi_analysis) November 5, 2022
Pass Networks
Man City 2 - 1 Fulham pic.twitter.com/7IAOHURW6t
VisualGame's most progressive players in Europe
Most threatening players in Europe so far this season. pic.twitter.com/6UbNN19mvG
— VisualGame (@avisualgame) October 31, 2022
The code
I hope you enjoyed today's post. As always, you're welcome to take a look at my code and reproduce the visual.
If you get consistent value out of the site, consider becoming a paying member to support the improvement and content available on the website. I would really appreciate it!
All you need to do is check out my GitHub to get access to the notebook and the data behind it.


