


Hi everyone!
Welcome to the fifth issue of the Viz of the Week newsletter, where I'll be featuring a new visual each week and sharing the code behind it.
Shoutout to all the +60 new subscribers that joined this week. 🤍
If you wish to receive these posts straight to your inbox, subscribe to join the community and receive free updates!
In today's visual, we'll be using a statistical function called the Brier Score, which essentially helps us assess the accuracy of probabilistic predictions, and apply it to FiveThirtyEight's Premier League forecasts for the 2021/2022 season.
But, what exactly is the Brier Score?
Here's an example.
FiveThirtyEight's forecasts for the match between Manchester City and Southampton at the Etihad, assigned the Citizens an 83.2% chance of winning the game, with only a 4.8% chance of victory for the Saints and a 12.0% probability of a draw.
Despite Man City creating 1.2 xG vs. the 0.5 xG generated by the Saints, the match ended in a goalless draw in mid-September.
The Brier Score is extremely useful to evaluate these forecasts, as it computes the mean squared difference between the predicted probabilities of the possible outcomes and the actual result.
The observed outcomes are assigned a value of one, in case of happening, and zero otherwise. Therefore, in our example, the outcomes of Man City and Southampton victories are assigned a value of zero, whereas the draw is assigned a value of one.
Then, the Brier Score is calculated as follows:
\(\mathrm{BS} = \frac{1}{3}\left[(0.832 - 0)^2 + (0.12 - 1)^2 + (0.048 - 0)^2\right] = 0.489\)
Therefore, the lower the Brier Score, the better the forecast.
The neat thing about this scoring function is that it depends on all the probabilities assigned by the forecast system, so if you make bold predictions and these fail, you are penalized heavily.
Consider the same example, but where instead of assigning an 83% chance for Man City to win, we gave them only a 50% chance of winning and a 38% chance of victory for Southampton. Then, our score would improve materially.
\(\mathrm{BS} = \frac{1}{3}\left[(0.5 - 0)^2 + (0.12 - 1)^2 + (0.38 - 0)^2\right] = 0.212\)
Notice how the score improves, even though we didn't change the probability assigned to a draw, which turned out to be the actual outcome.
Now that the statistical jargon has been covered, let's get to the viz.
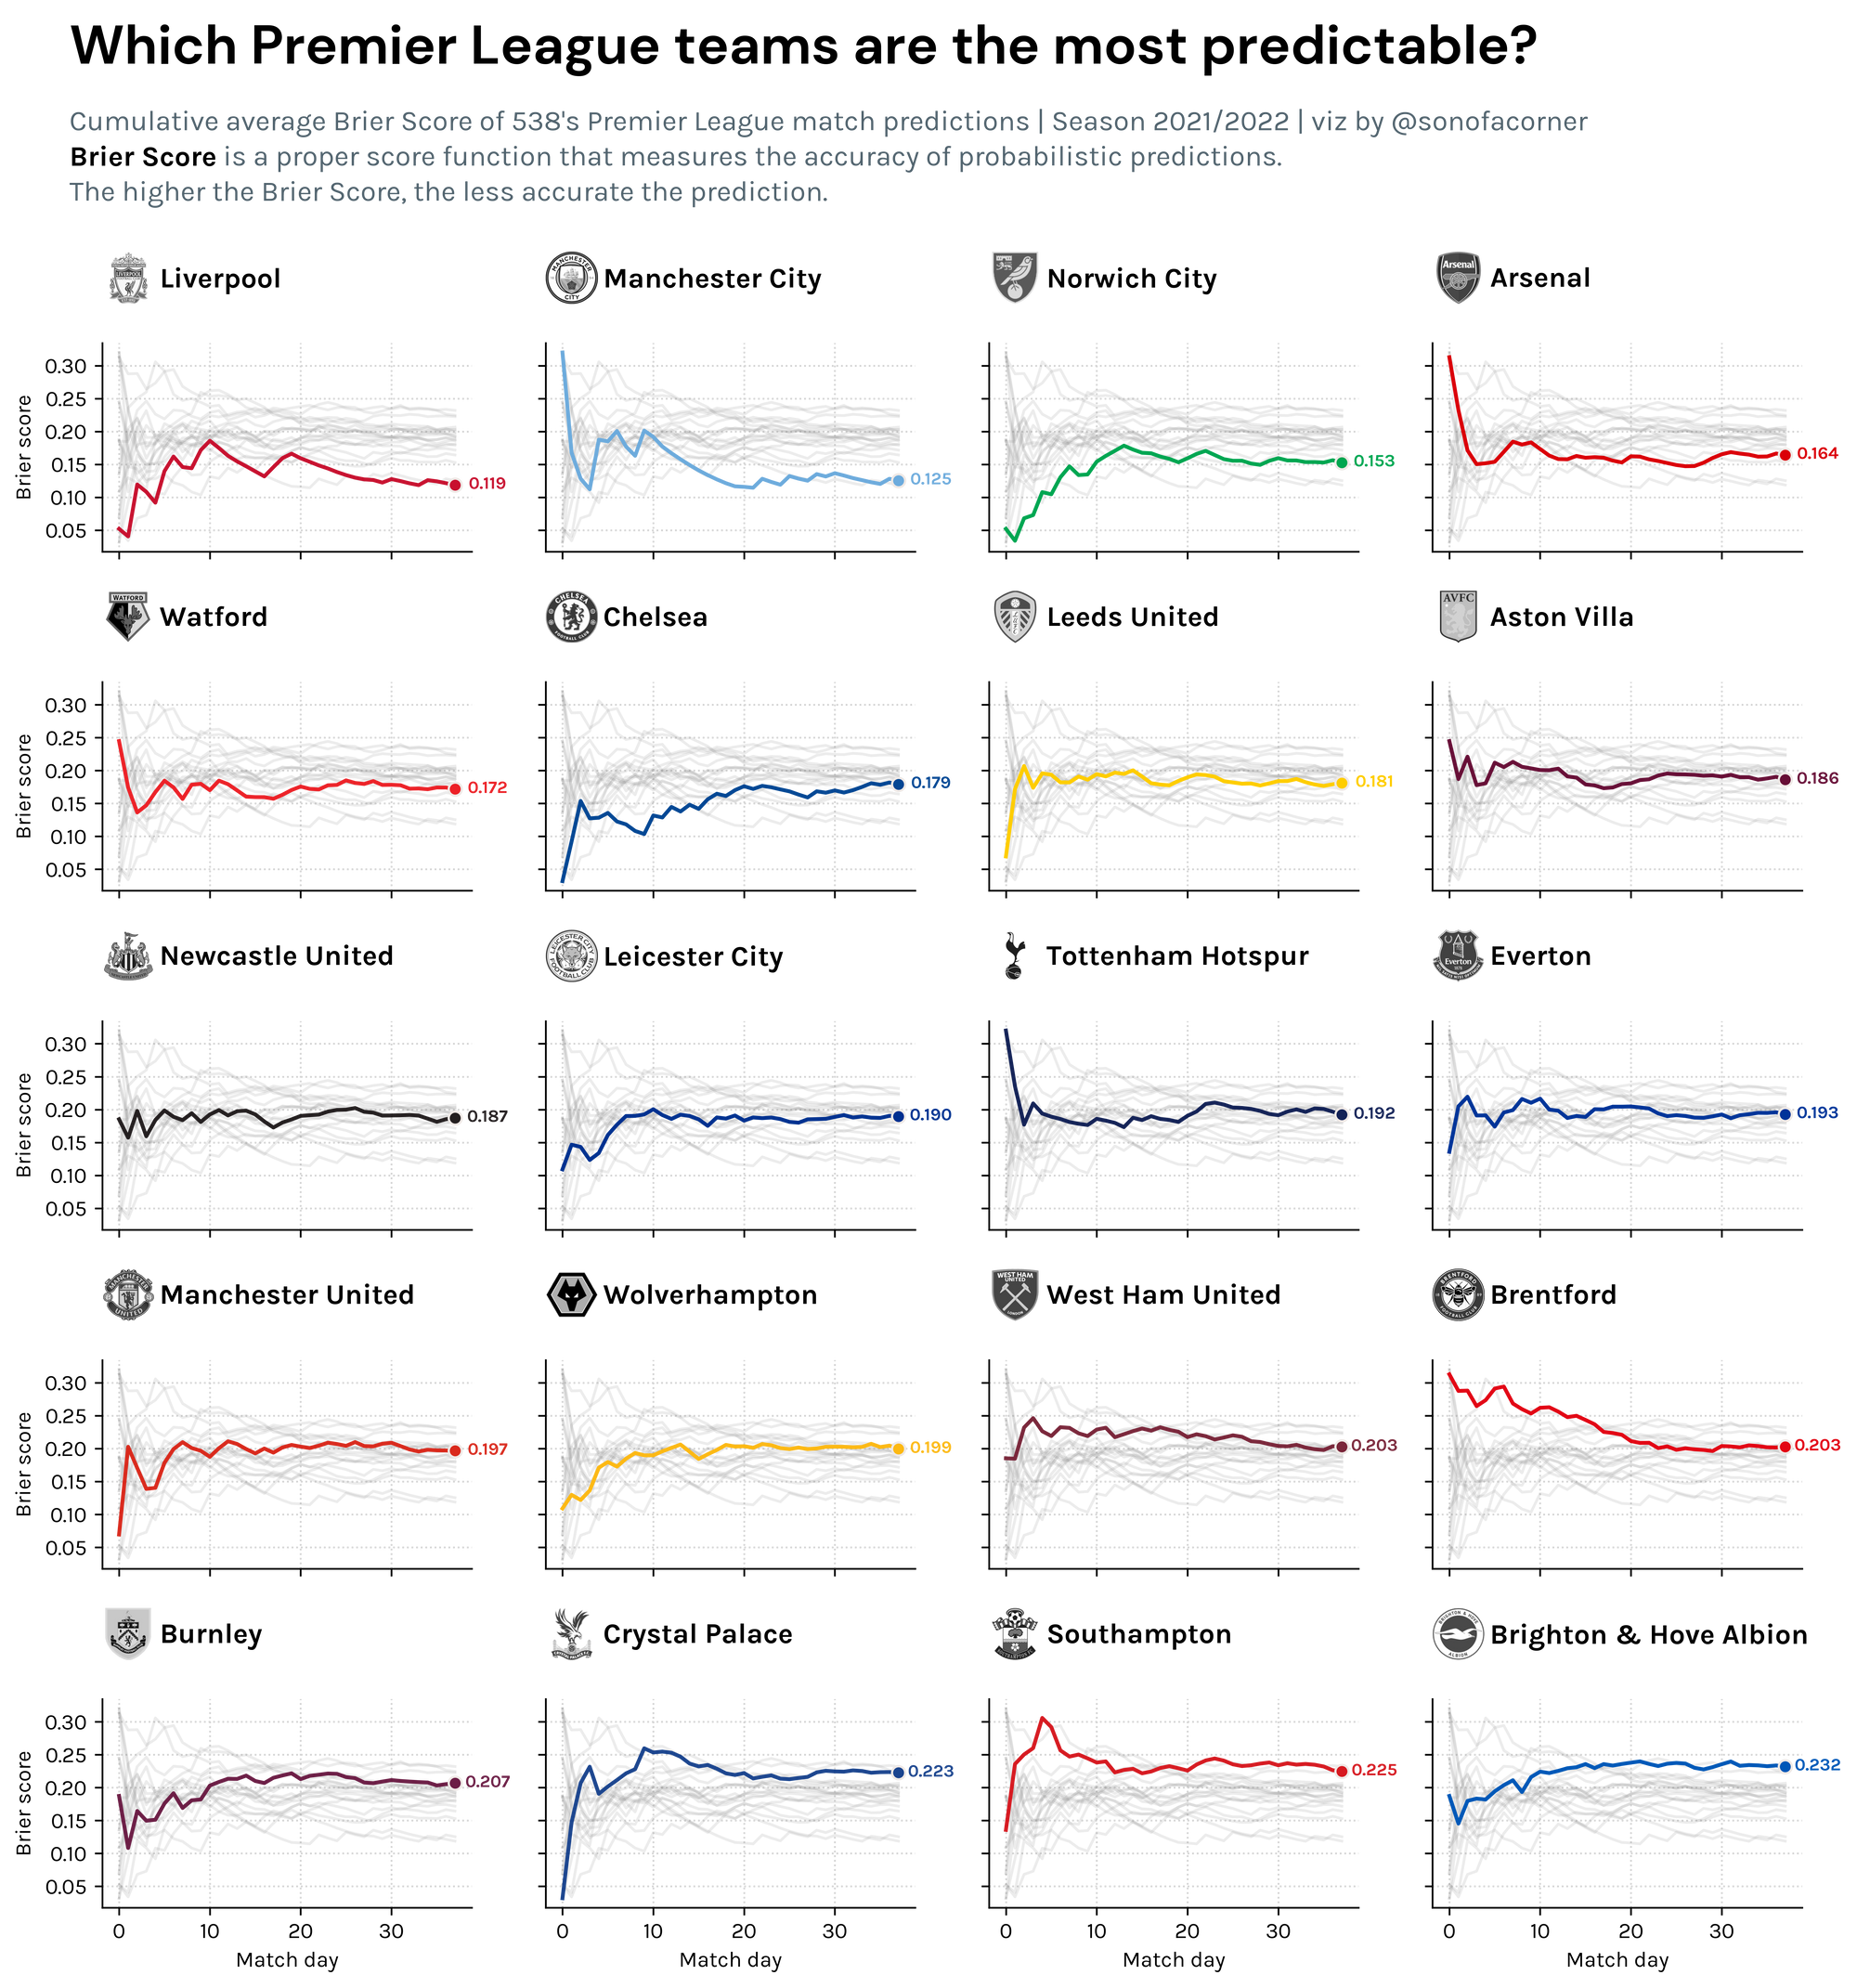
In this example, I computed the cumulative average error of FiveThirtyEight's forecasts for each side, to check which Premier League teams were the most predictable.
Here are the results:
The code
Hope you learned something new from this issue!
If you're interested in replicating the above visual, check out my GitHub to get access to the code and data behind it.
Note: I can't upload any more zip files because they charge me 😢
If you enjoy these posts and charts, please help me by subscribing to my website and sharing my work.
Until next week! 👋


