


Hi everyone!
Welcome to the seventh issue of the Viz of the Week newsletter, where I'll be featuring a new visual each week and sharing the code behind it.
I want to give a big welcome to the 27 new subscribers that joined this week. 🤍
If you haven't subscribed and wish to receive these posts straight to your inbox, subscribe to join the community and receive free updates!
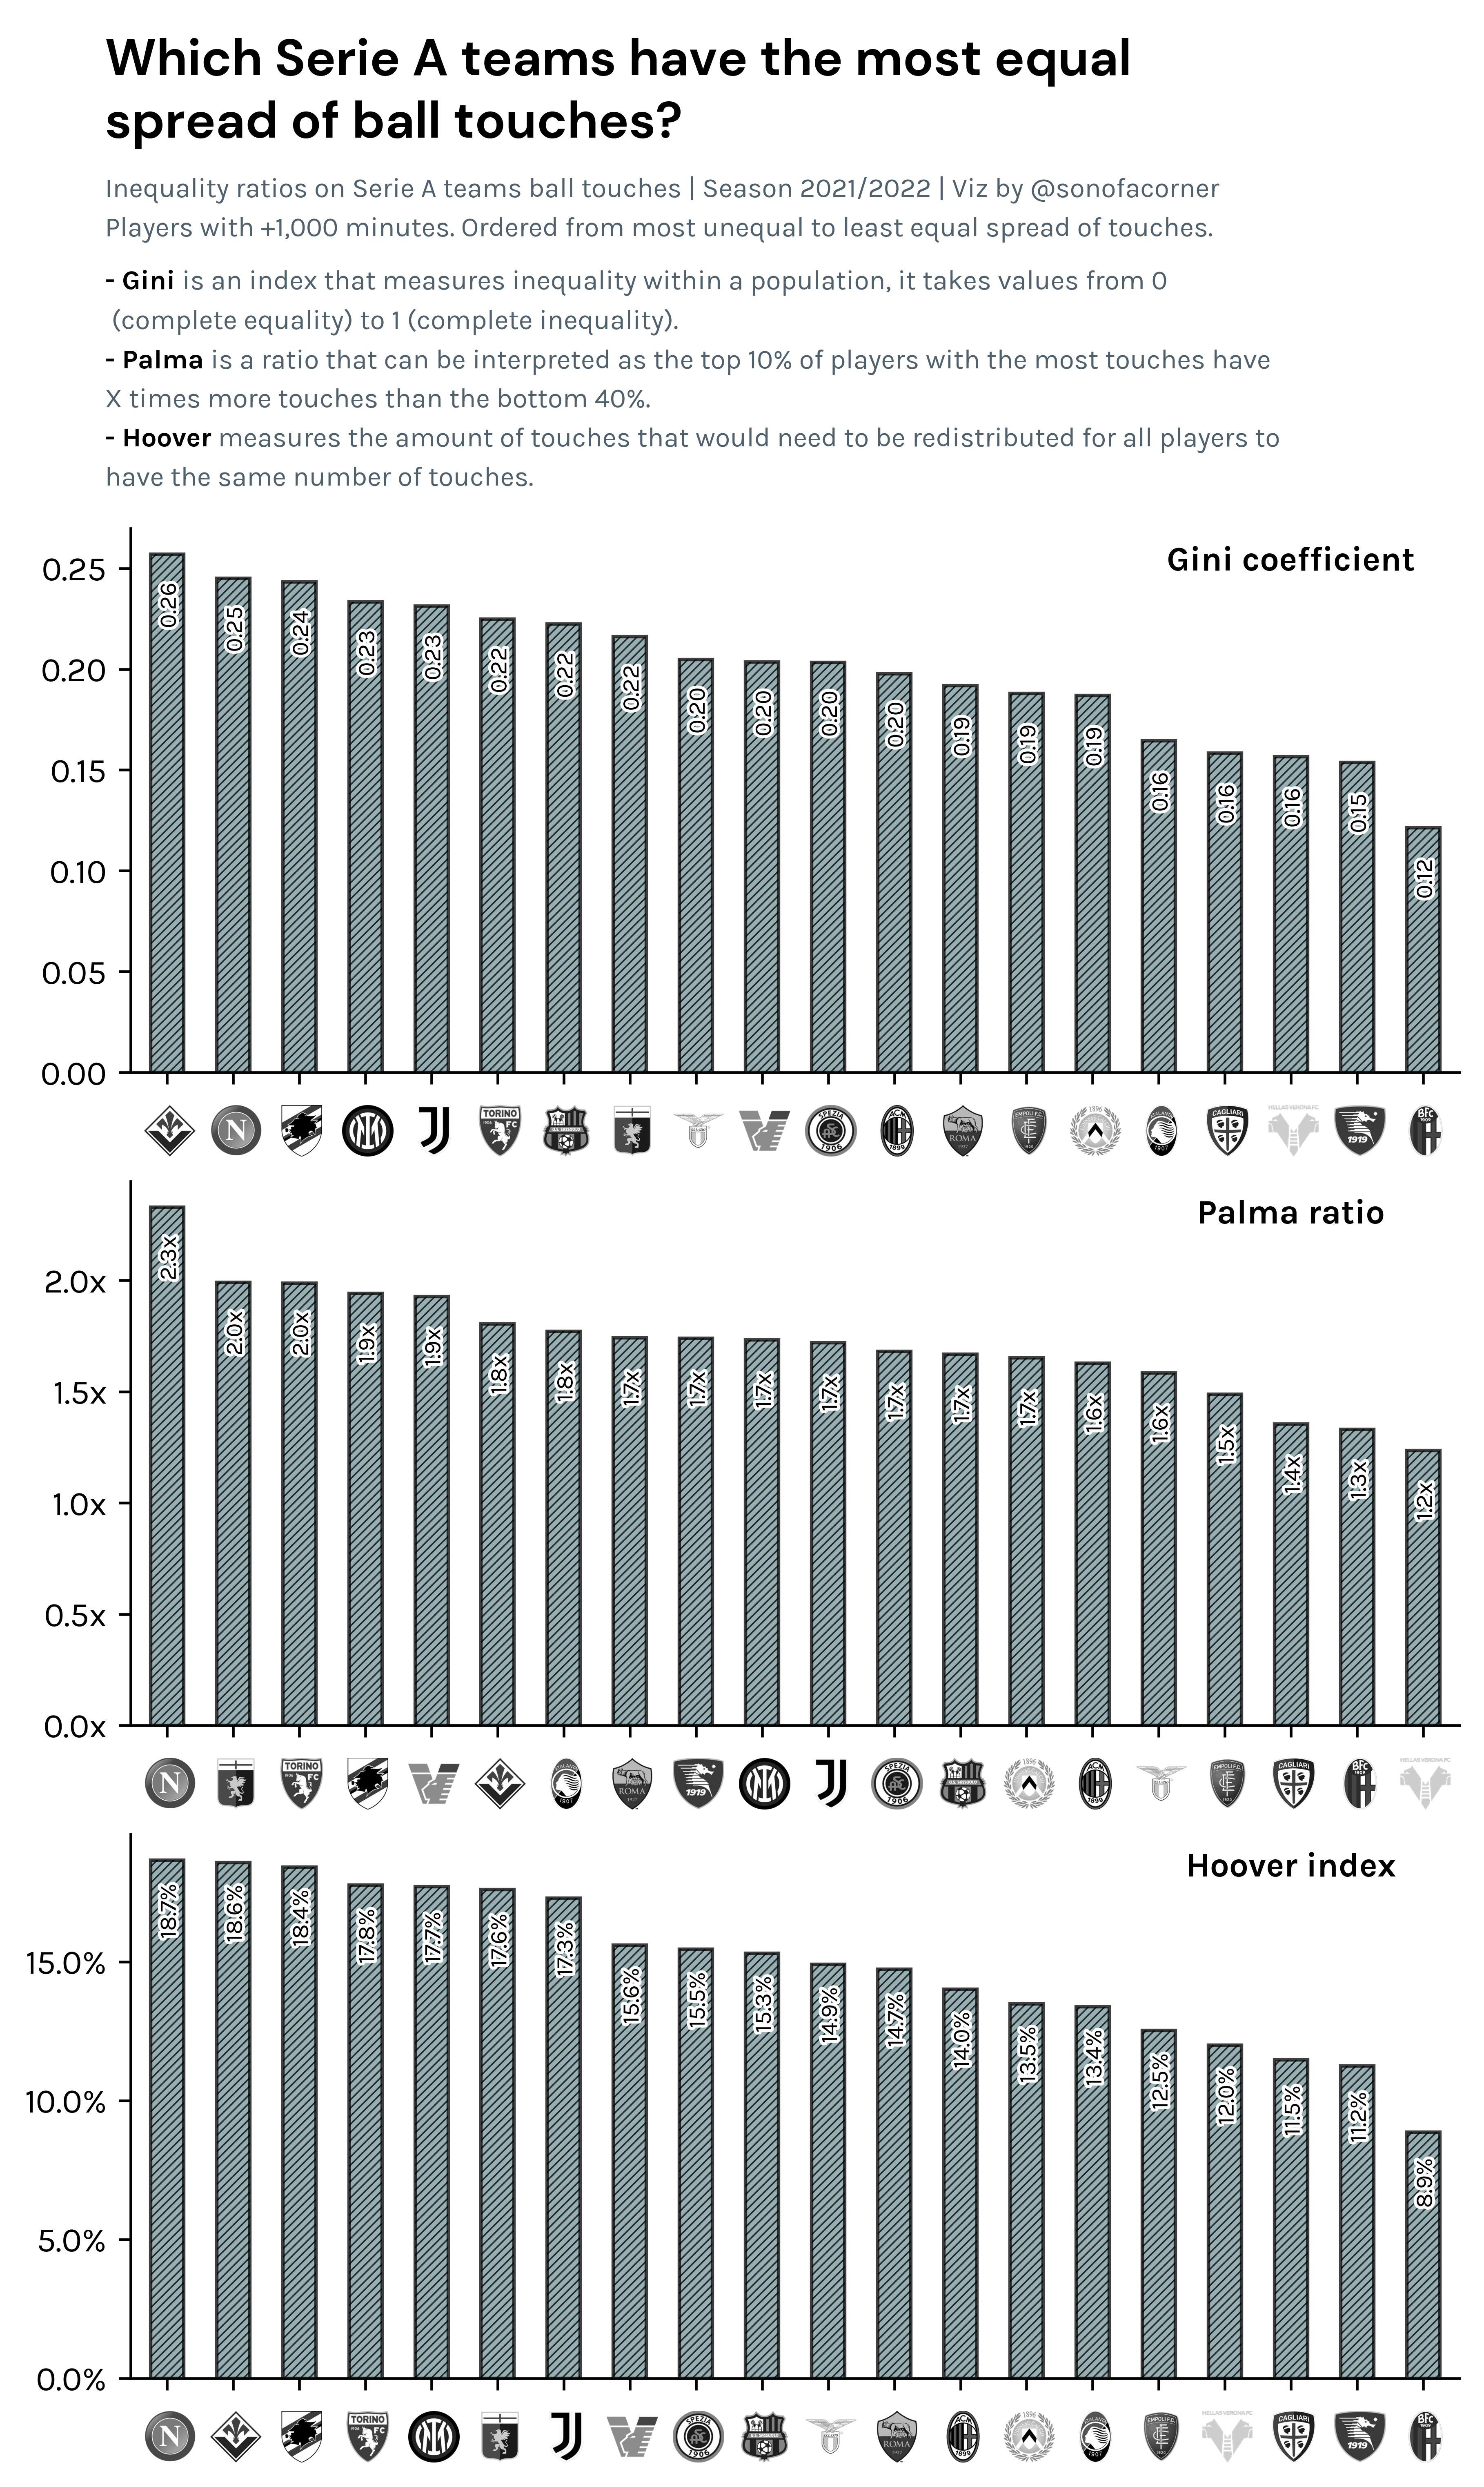
Today's featured visual was inspired by a tweet I saw a couple of months ago from Ben Griffis, where he used the Gini coefficient – a common metric to measure inequality in economics – to see which teams had the most (un) equally distributed share of ball touches within the squad.
Despite the Gini coefficient being a useful metric, there are certain limitations in its calculation that fail to capture extreme values within a population's tails.
I decided to build upon Ben's idea and look at other metrics, such as the Palma Ratio and the Hoover Index, which allow us to gain further context on how a certain resource is distributed within a population and therefore, inequality.
Note, a resource can be anything from wealth, ball touches, goals, etc. In this case, the resource is ball touches per player and the population is the team's players.
In essence, the Palma Ratio divides the resource's share of the population's top 10% by that of the bottom 40%, a calculation that can be easily interpreted as the wealthiest 10% of the population having X times more than the lowest-earning 40%. On the other hand, the Hoover Index computes the percentage of the population's total resources that would have to be redistributed to make all resources equal.
Notice that by using three different metrics we are able to gain better insight into the data.
An extreme example of the difference between results is Salernitana's ranking within the Serie A teams. The Granatas have one of the most equal spreads of ball touches amongst Serie A teams according to the Gini Coefficient and the Hoover Index – however, the Palma Ratio ranks them 8th within the league, with the top 10% of players with the most touches having 1.7 times more touches than the bottom 40% – which implies that there are extreme values within the sample's tails.
One thing is clear though. Napoli, Fiorentina, and Sampdoria concentrate most of the ball within a small set of players.
The code
I hope you enjoyed and learned something new from today's post. As always, you're welcome to take a look at my code and reproduce the visual.
All you need to do is check out my GitHub to get access to the code and data behind it.
If you enjoy these posts and charts, please help me by subscribing to my website and sharing my work.
Until next week! 👋
A big shoutout to Ben for the inspiration. If you like stats and football make sure to give the man a follow, he produces great stats-related content on a regular basis.


