


Hey everyone!
Welcome to the 23rd issue of the Viz of the Week newsletter, where I'll be featuring a new visual each week and sharing the code behind it.
It's been a good long break for me to focus on some personal stuff, and I'm really excited to be back with new visuals each week, which I hope will help you learn more about Python and matplotlib using football data.
One of the things I've been doing during these weeks is learning how to scrape and use Who Scored data for the contents of the newsletter, so I'm happy to share with you a dataset of event data collected from every match in the 2022 World Cup.
Plus, we'll be looking at three visuals with the full code behind them so you can learn how to use this data for your analysis.
Viz 1.- Ball Recoveries
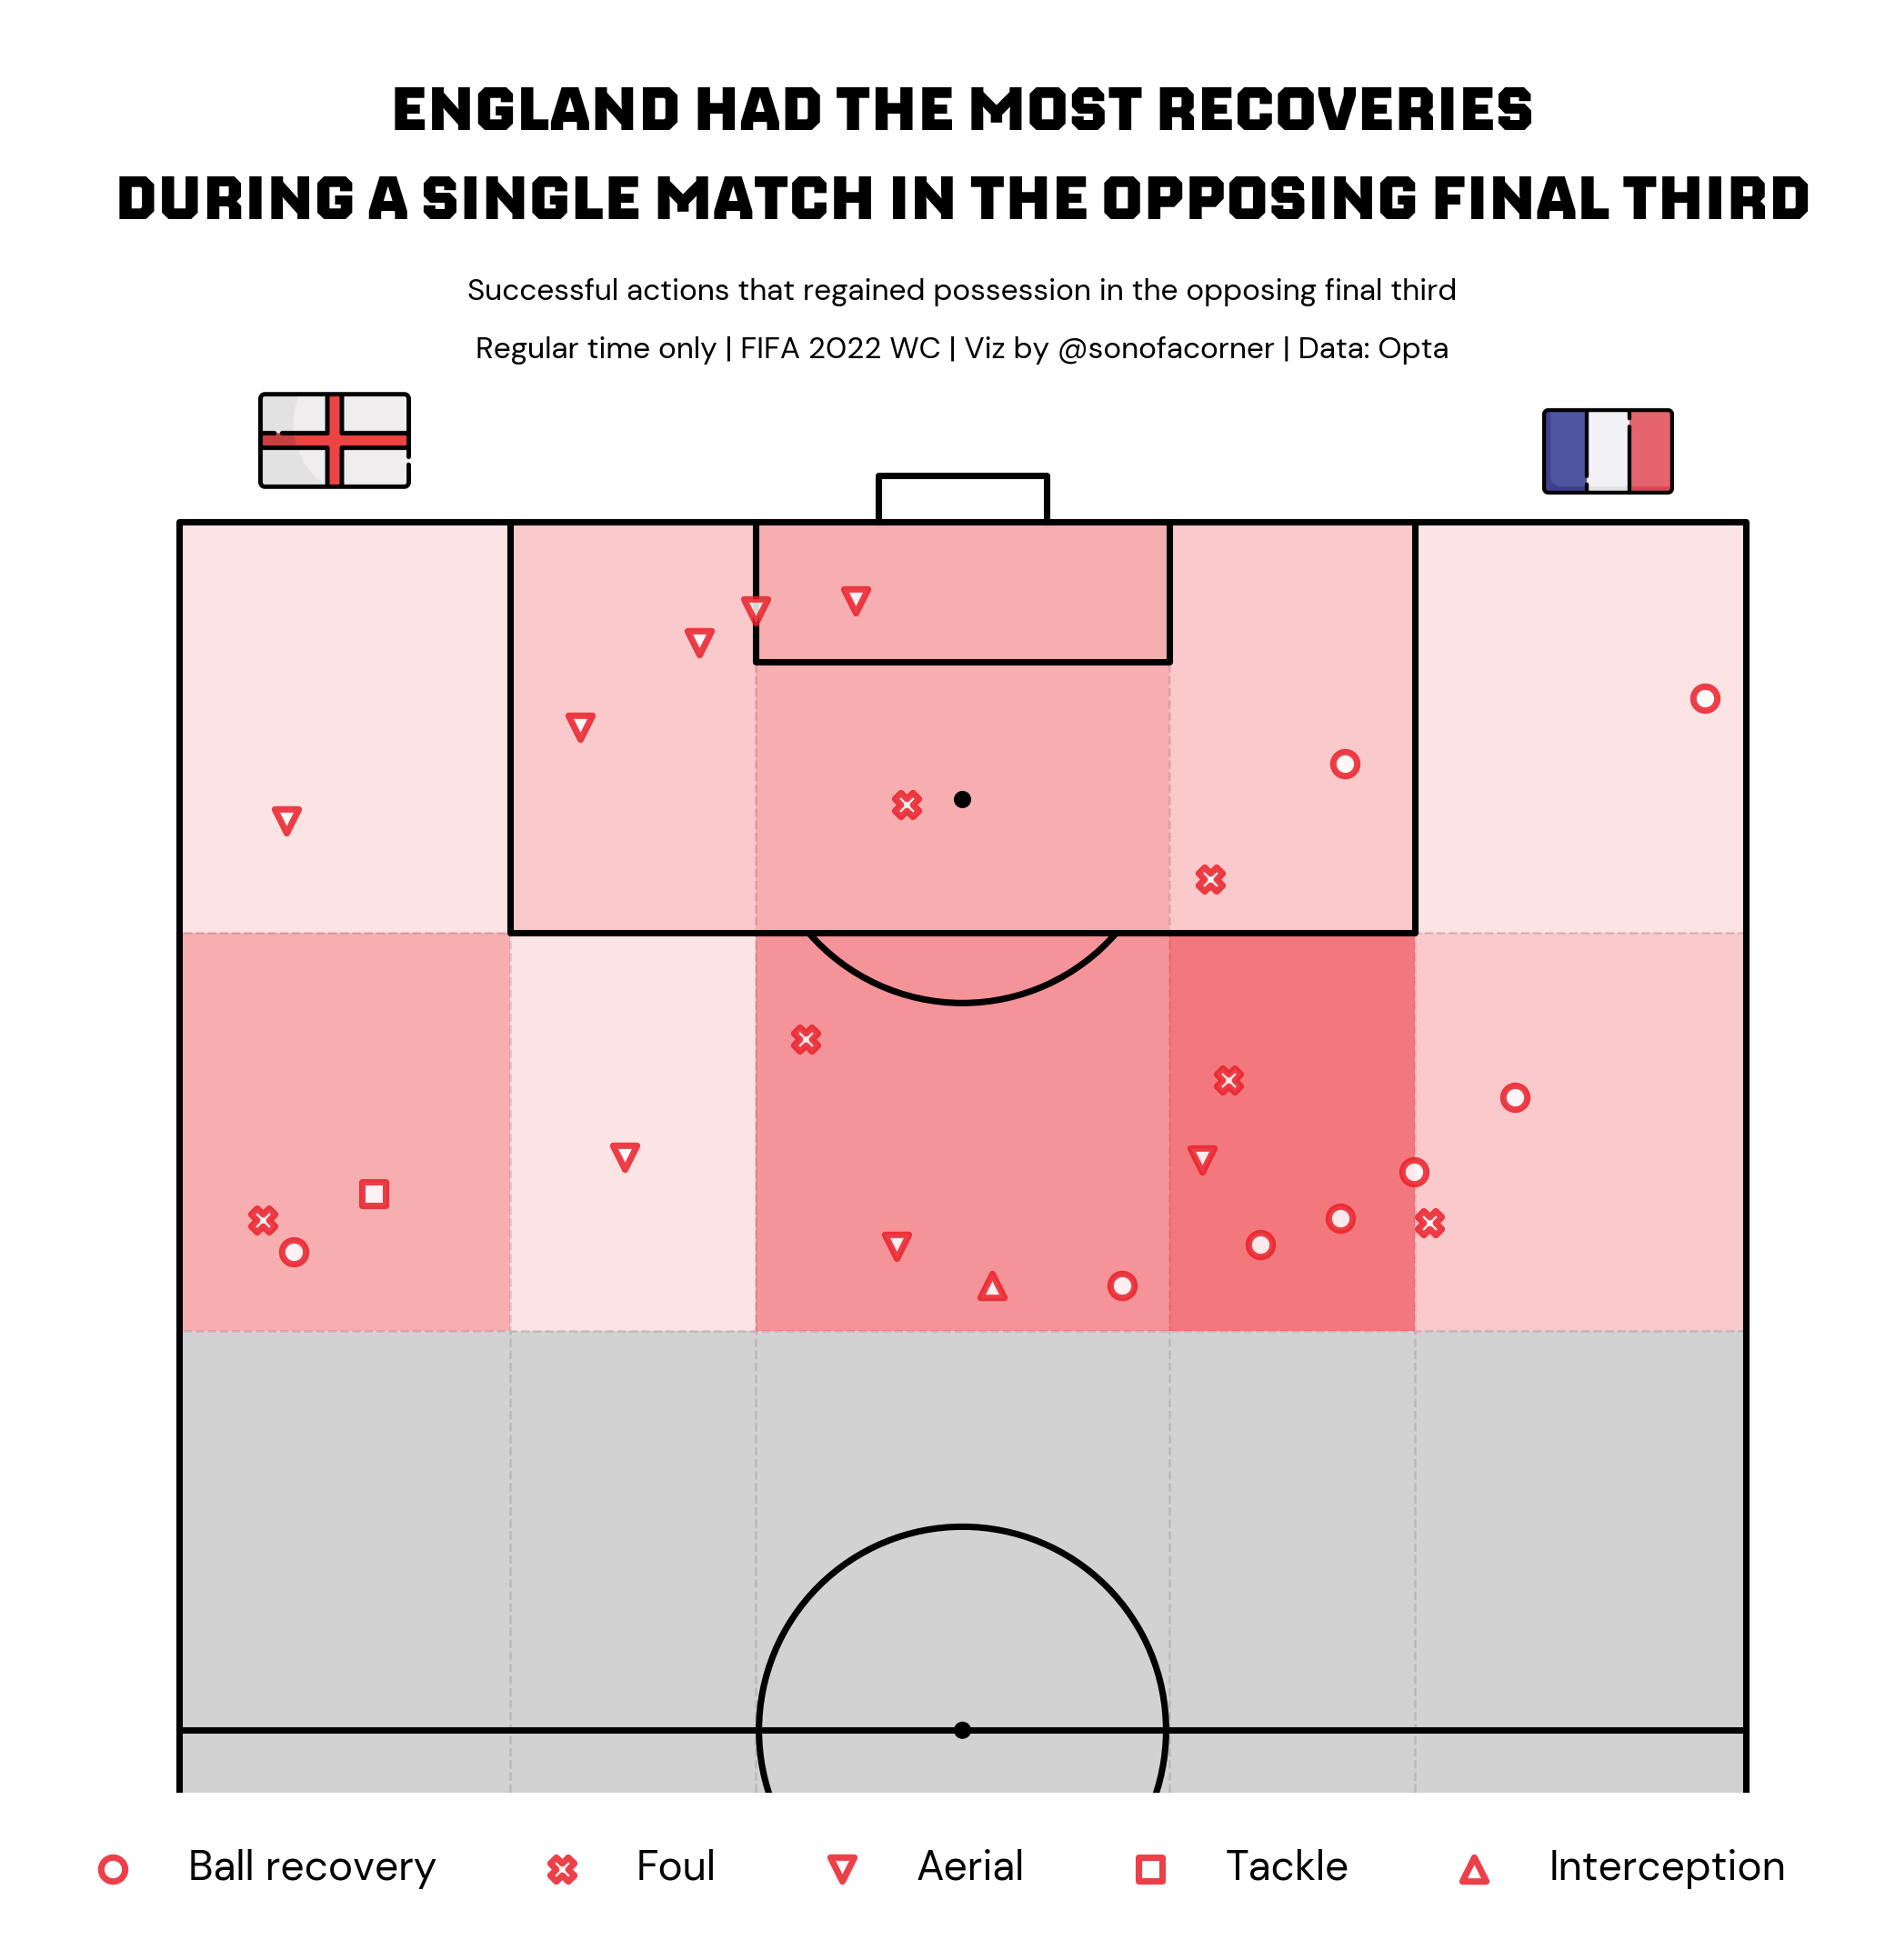
For the first visual of this post, I wanted to look at which team had the most ball recoveries in the opposition's final third in a single match during the World Cup.
I was quite surprised at the result, as England topped the list with 24 ball recovery actions in the quarter-final against France – a match they didn't deserve to lose (in my opinion).
Other notable countries on the list were Mexico, Germany, and Wales, who recorded 23 ball recovery actions in their fixtures against Saudi Arabia, Japan, and Iran, respectively.
Viz 2. - Most passes in a single match
This one was a bit tricky for me as I had never done any pass visualizations before. However, as you will see in the code, it's quite straightforward to plot passes in Python with just a couple of lines of code.
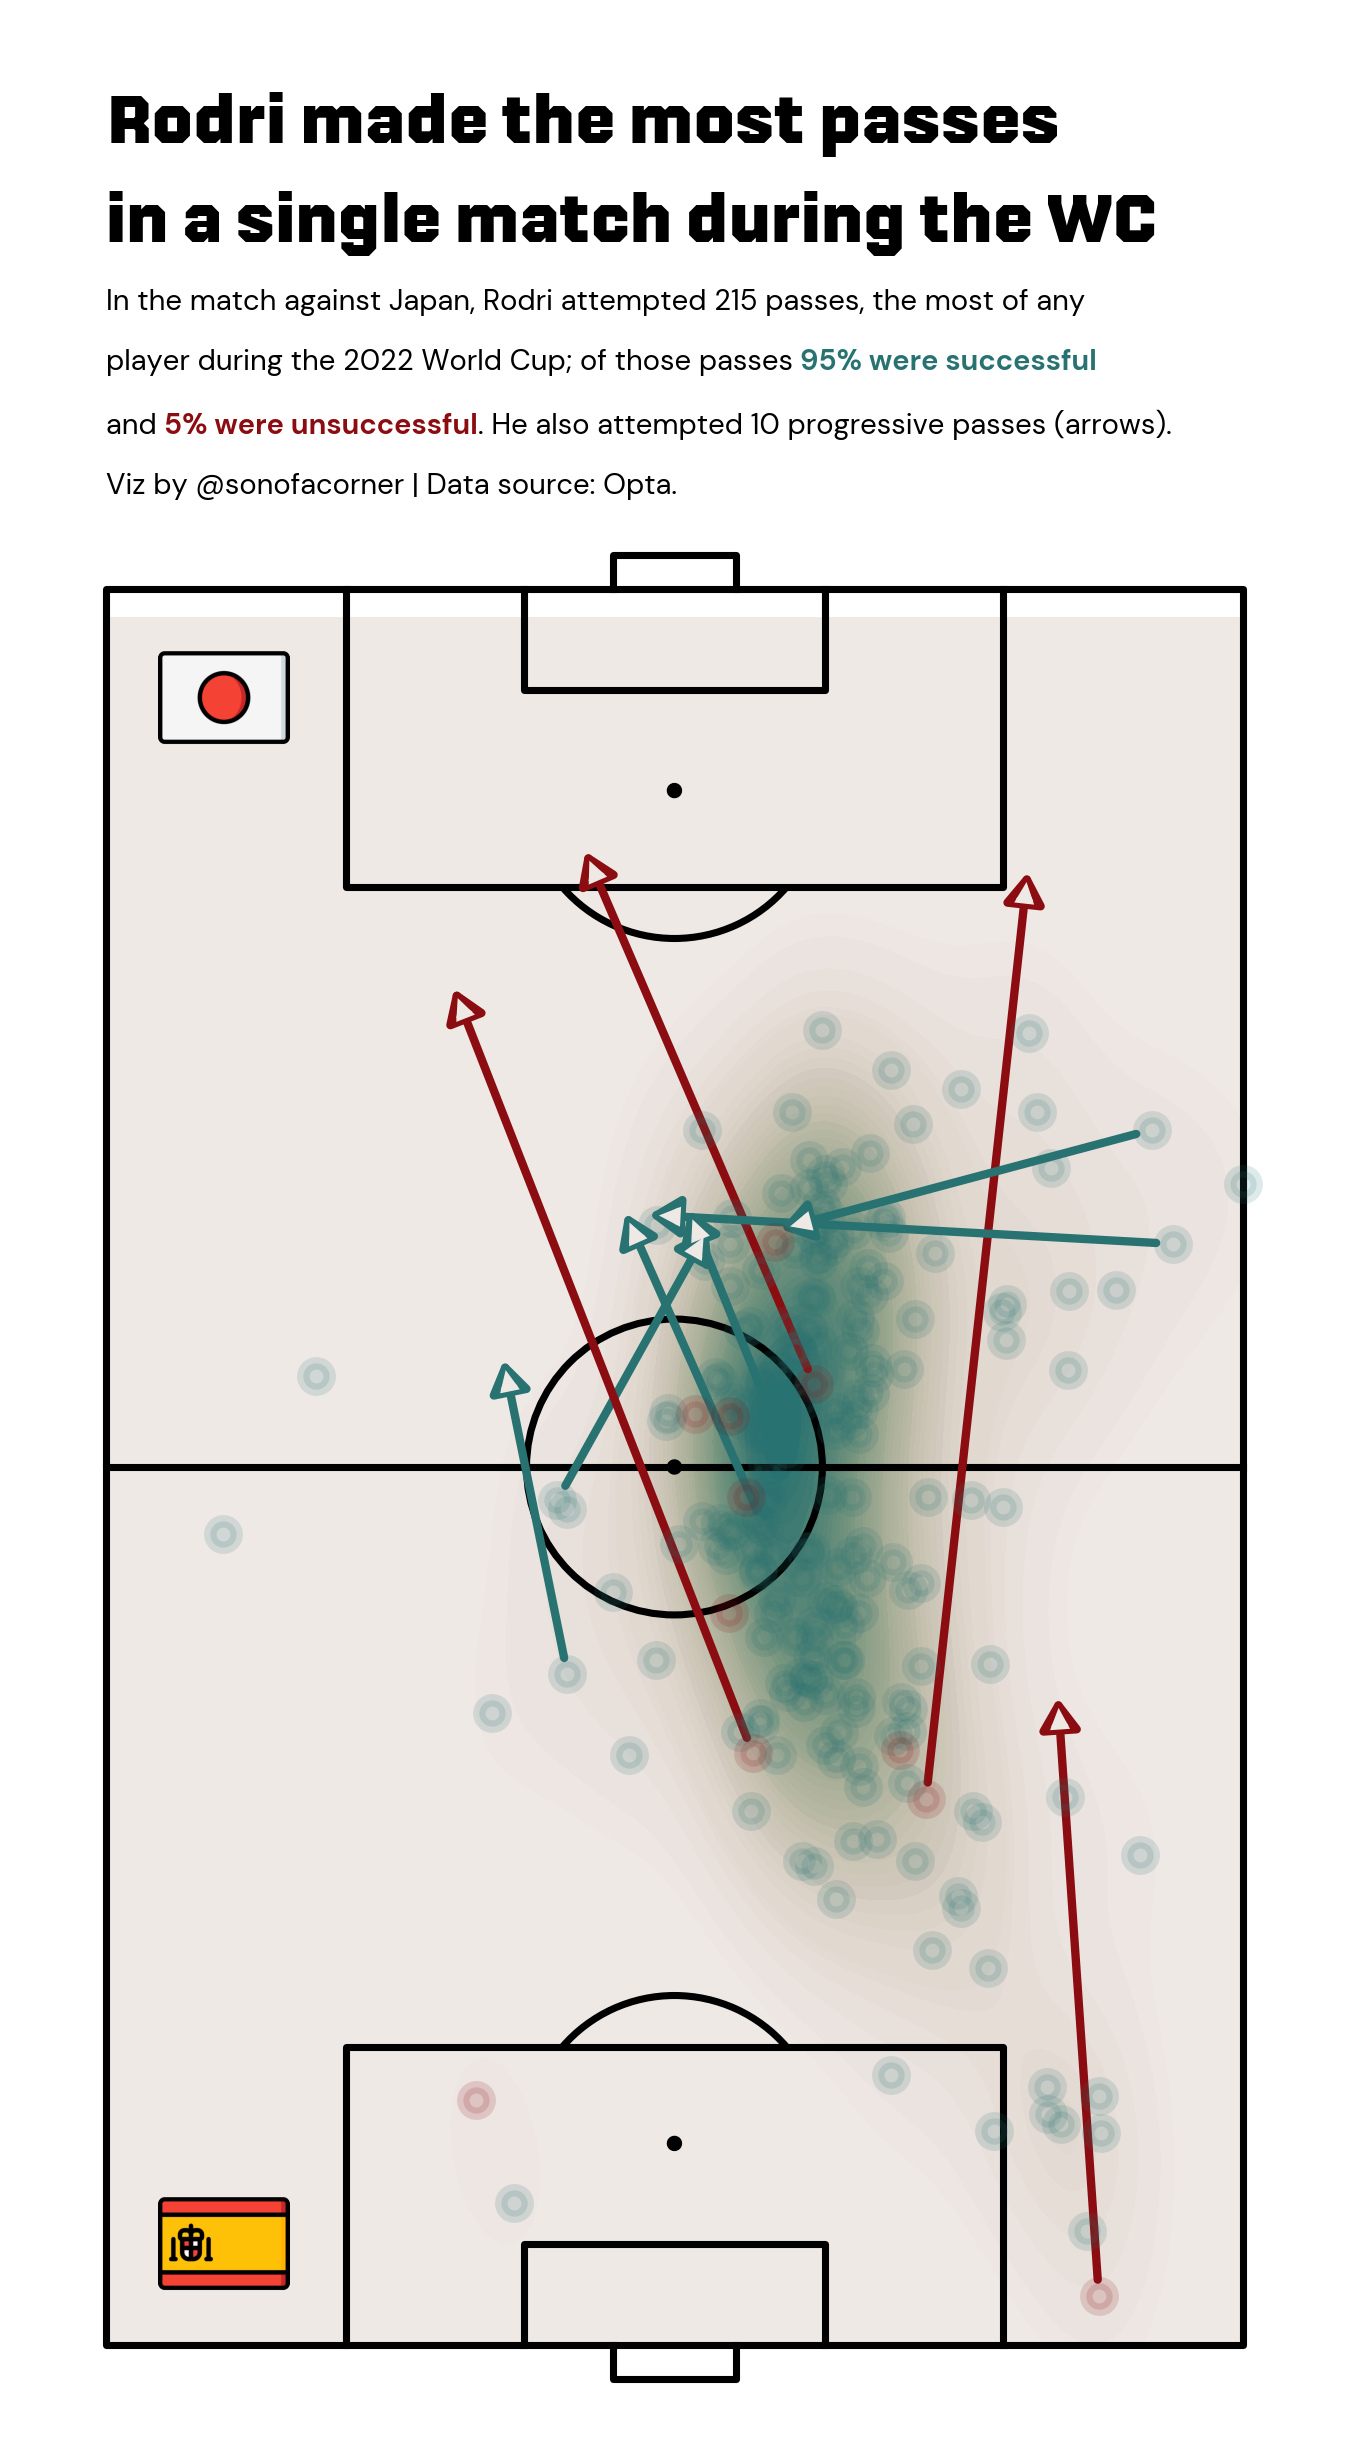
In this viz, we look at which player attempted the most passes during the World Cup – with Rodri topping the rankings by attempting 215 passes (excluding throw-ins, etc.) – a figure 14% higher than the next player in the list (Pau Torres, with 189 passes against Japan).
Viz 3. - Contested zones
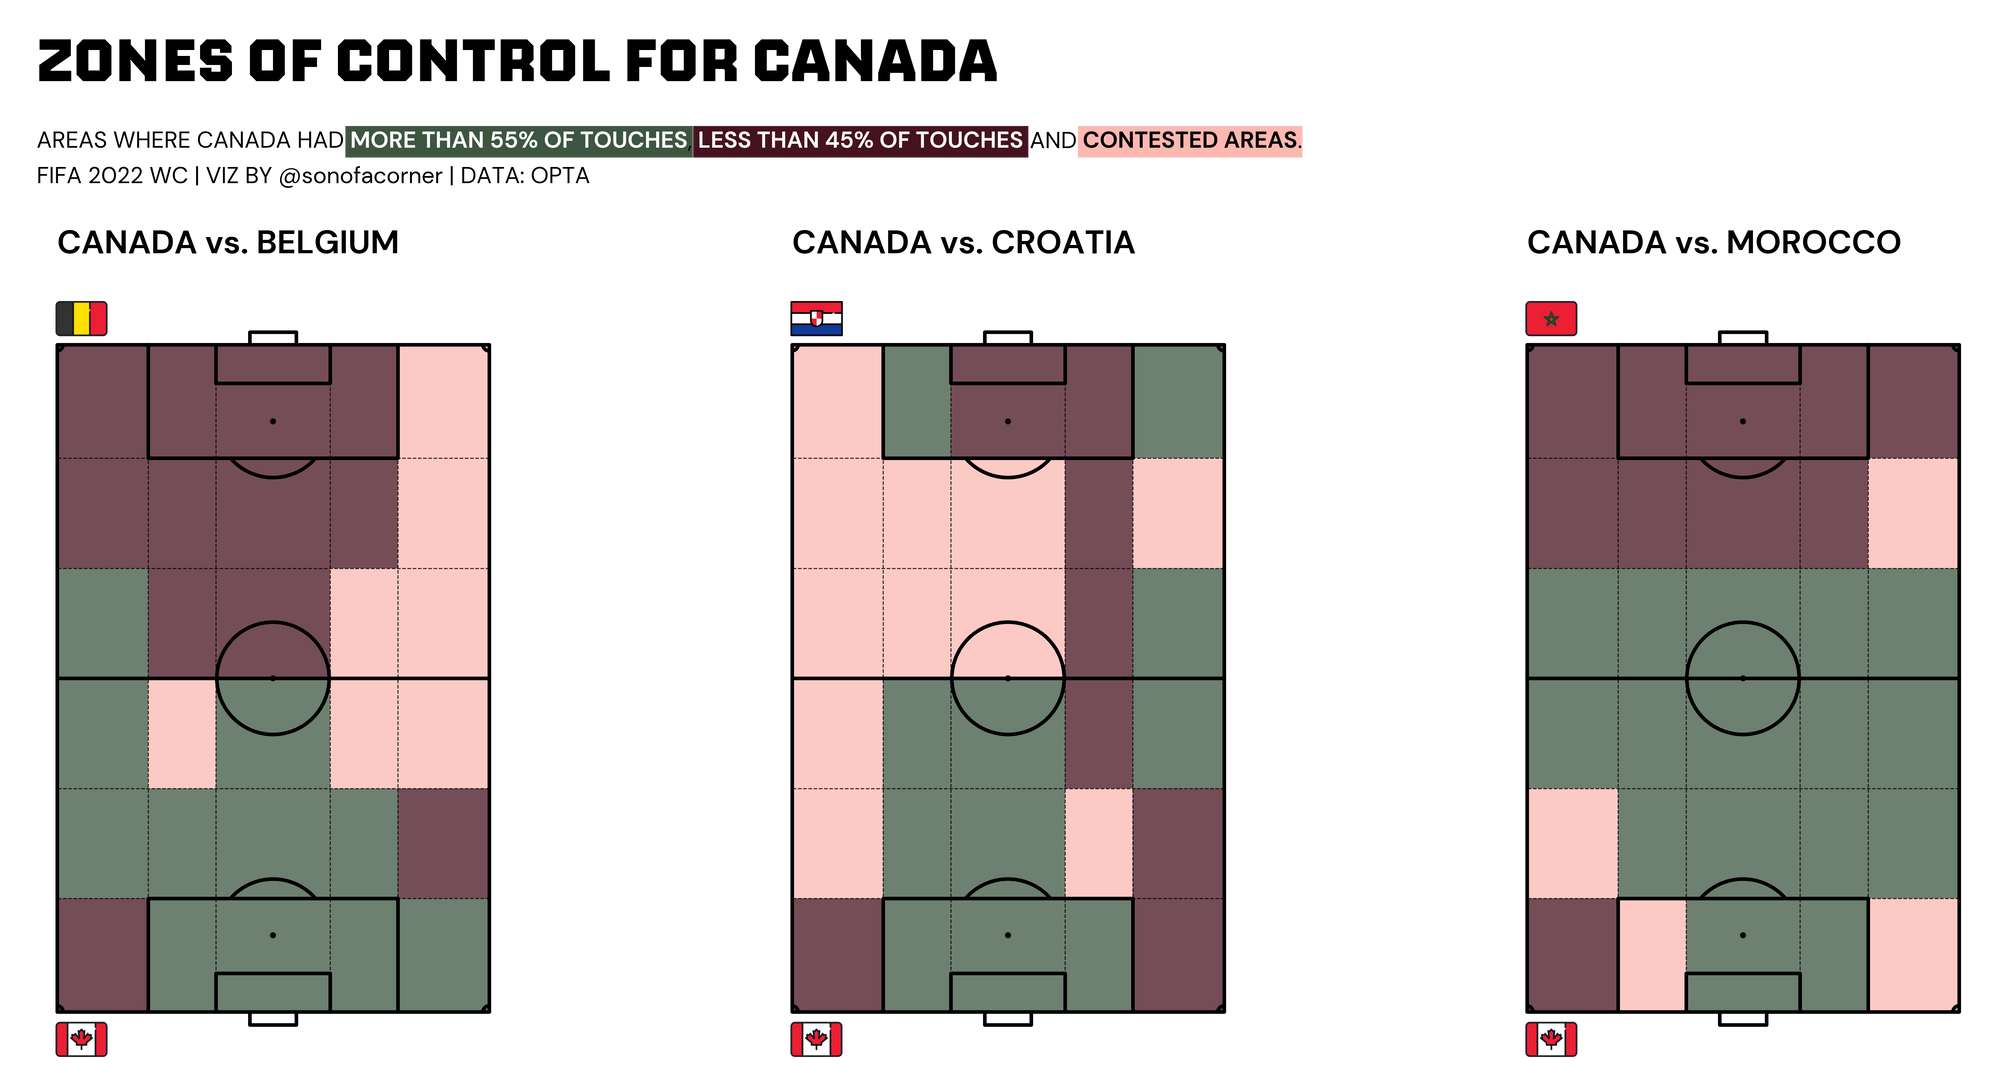
For our final visual this week we'll look at contested zones for all Canadian matches during the World Cup.
This one was a bit trickier to make, but it was worth it :)
The code
I hope you enjoyed today's post. As always, you're welcome to take a look at my code and reproduce the visual.
The main idea of this is to share all of the event data from the World Cup and some basic examples of what can be done with these types of datasets.
All you need to do is check out my GitHub to get access to the notebook and the data behind it.


