


Hi everyone!
Welcome to the 16th issue of the Viz of the Week newsletter, where I'll be featuring a new visual each week and sharing the code behind it.
Can't believe it's been 4 months already (thanks to everyone that has supported this project)!
I want to give a special welcome to the 41 new subscribers that joined this week. 🤍
If you haven't subscribed and wish to receive these posts straight to your inbox, subscribe to join the community and receive free updates!
I'm really excited about today's post. Honestly, I think this is the prettiest visual I've done to date, so I really hope you enjoy it and learn something from the code.
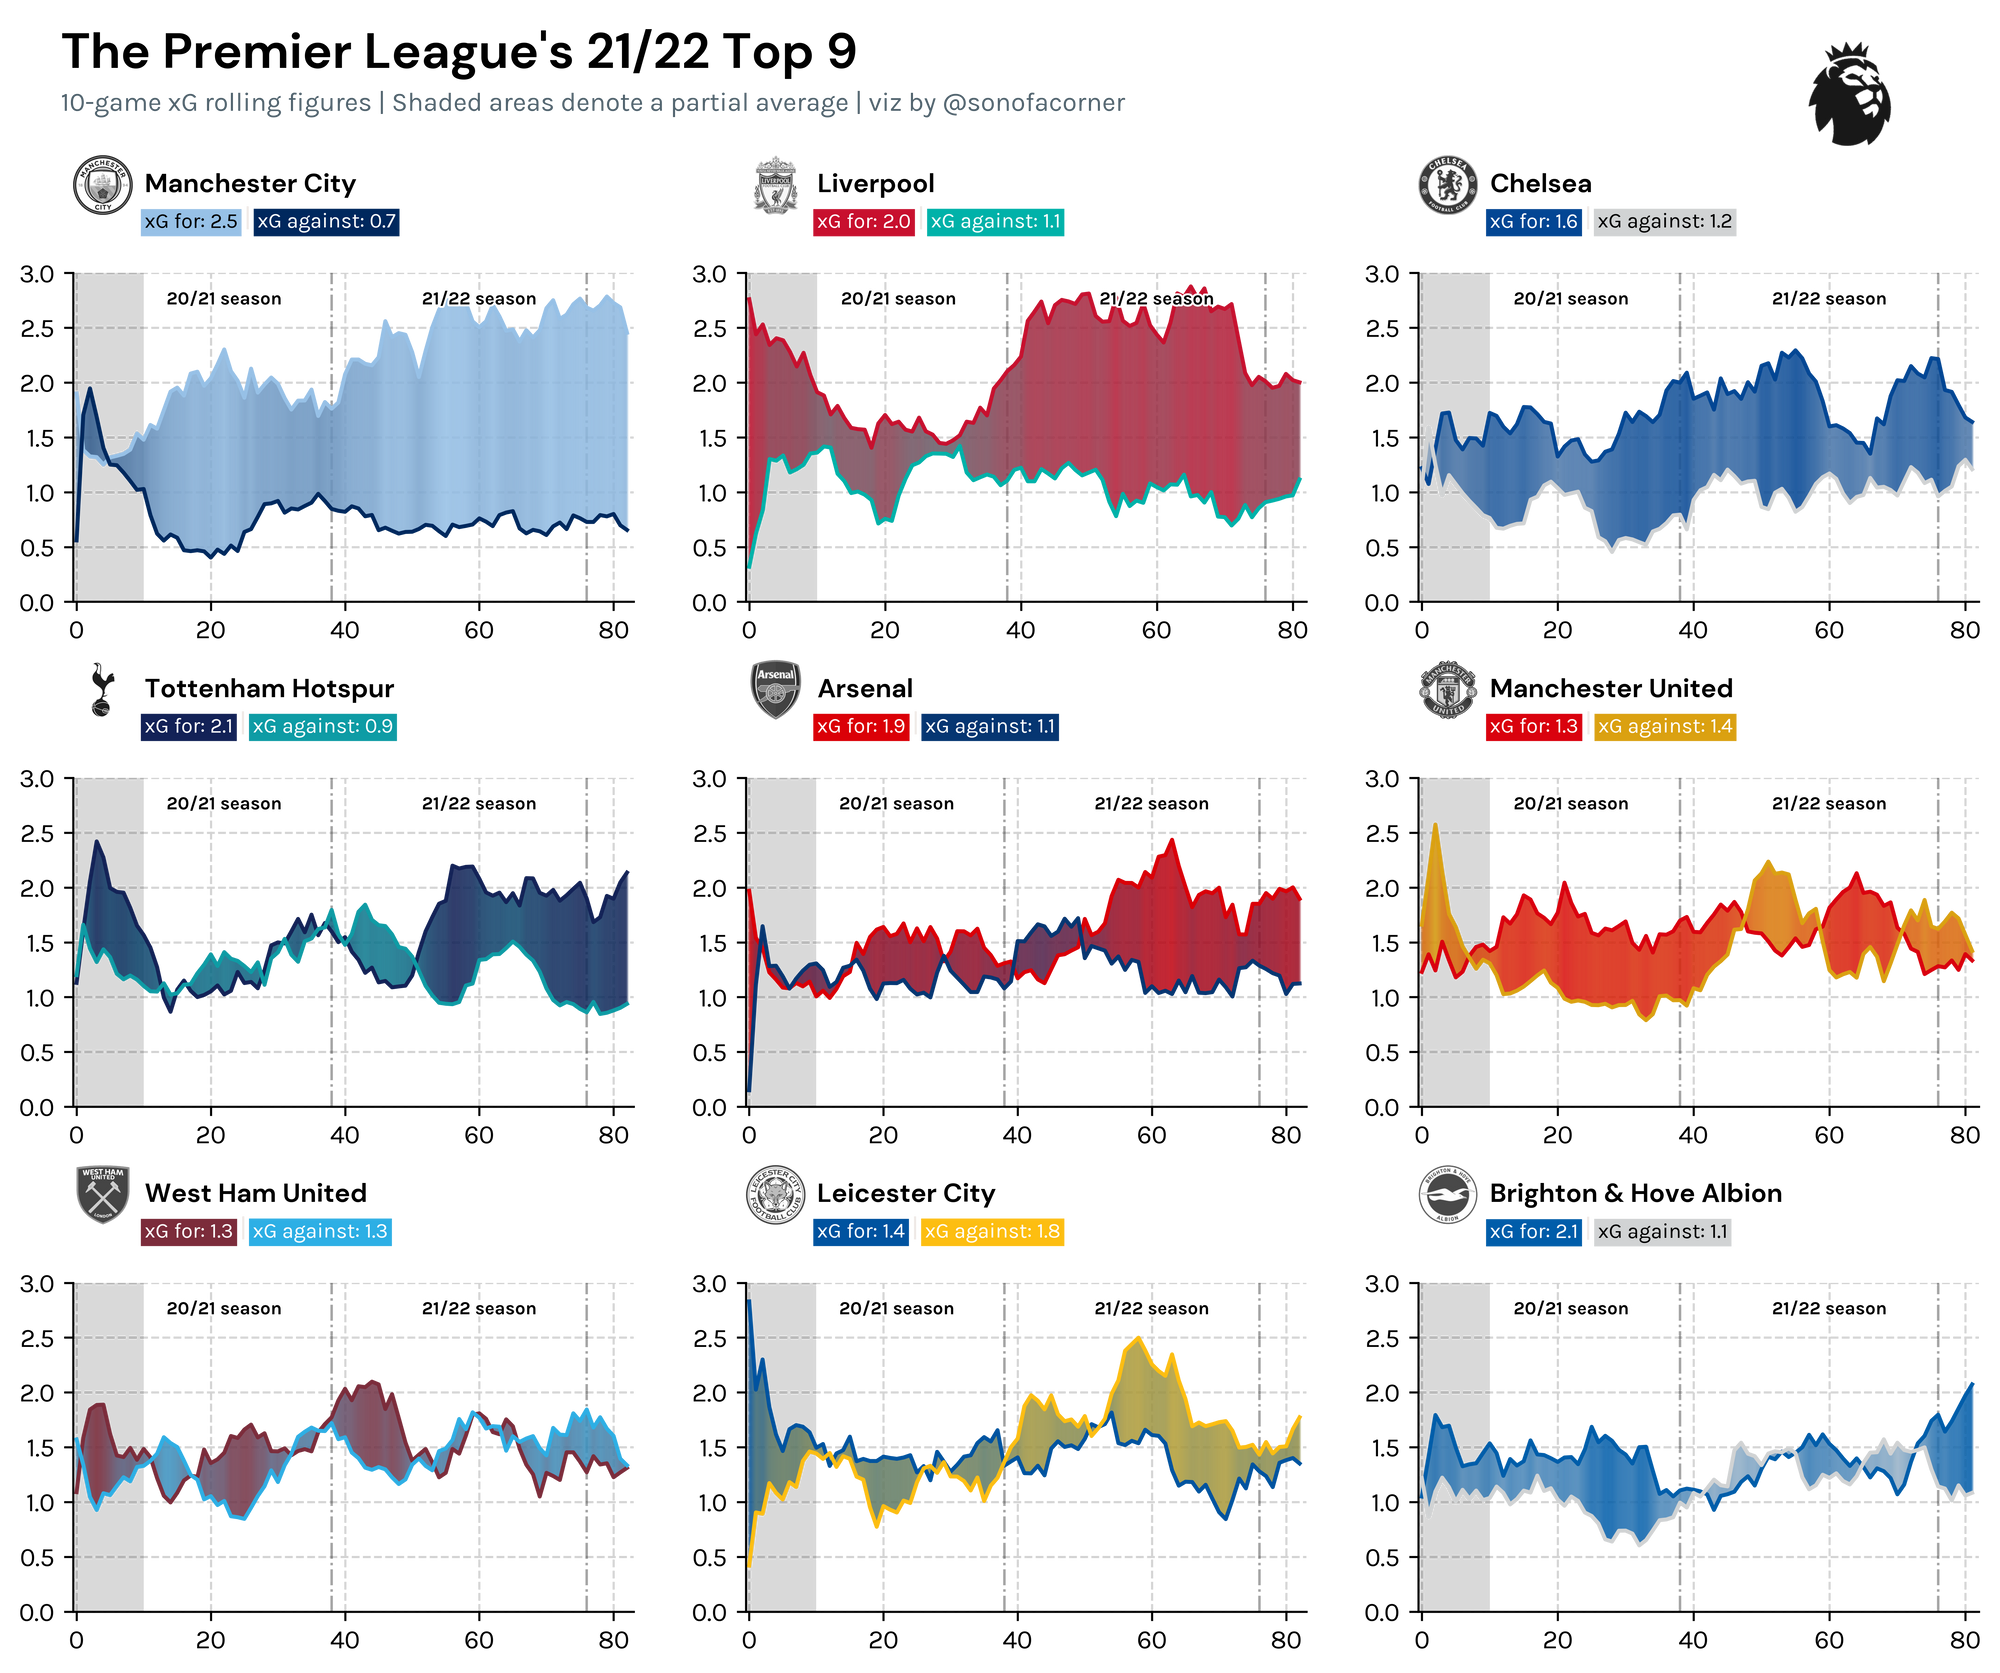
For today's visual, I look at xG rolling figures, of the past three seasons, for the teams that finished in the top half of the table in the 2021/2022 Premier League season.
From Around the Grounds
If you'd like to be featured in this section @ me on Twitter so I can see your work 😊.
Barcelona Squad Table by Yayha Rashwan
Kudos to Yayha for his great use of the table's tutorial.
I love the font, background color, and most of all, his great use of the battery chart in the % of minutes played column.
Using @sonofacorner's great tutorial about tables in Matplotlib, I have created this table displaying squad playing time. I changed the font and the background color, and also changed the color of the bar chart to make it look like a battery 😂 🔋 pic.twitter.com/AzKOmnzrAw
— Yahya Rashwan (@Rush1_Analytics) September 20, 2022
Luton's touch map by @LutonAnalytics
This is an amazing visual.
Inspired by Jon Ollington's touch map viz, where players are positioned based on the line-up really gives the visual a beautiful and elegant touch.
🆕 Luton Town player's touch maps from the recent 2-0 win over Blackburn at Kenilworth Road.
— Luton Town Analytics 👒🧮📊 (@LutonAnalytics) September 24, 2022
Nicked @sonofacorner's beautiful code and the pitch layout inspiration is from the brilliant @jonollington.#LTFC🎩 #Rovers 🔵⚪️ pic.twitter.com/KVNNLRyO1T
La Liga xG Scatter by @casualfantasypl
Casual Fantasy Footballer is an awesome account to follow for great visuals. Plus, he's such a nice and helpful person.
I really love the way that he has grown in developing his style and matplotlib skills. Just look at this beauty 👇
Last but not least, i present to you data from #LaLiga
— casualfantasyfootballer (@casualfantasypl) September 10, 2022
Villarreal look to have had a comfortable start to the season and have capitalised. #LaLigaSantander pic.twitter.com/pbSZ66w8c6
The code
I hope you enjoyed today's post. As always, you're welcome to take a look at my code and reproduce the visual.
All you need to do is check out my GitHub to get access to the notebook and the data behind it.
If you enjoy these posts and charts, please help me by subscribing to my website and sharing my work.


