


Hi everyone!
Welcome to the tenth issue of the Viz of the Week newsletter, where I'll be featuring a new visual each week and sharing the code behind it.
I want to give a warm welcome to the 17 new subscribers that joined this week. 🤍
If you haven't subscribed and wish to receive these posts straight to your inbox, subscribe to join the community and receive free updates!
These past few days I've received tons of requests on how to make tables with matplotlib.
Even though, a full tutorial is in the works I decided I could switch things up a bit and share a (kind of) detailed notebook with the process of making a table in Python to help you get started.
For this week, I took a look at the second round of Bundesliga matches and created a summary table with the shot statistics for each fixture.
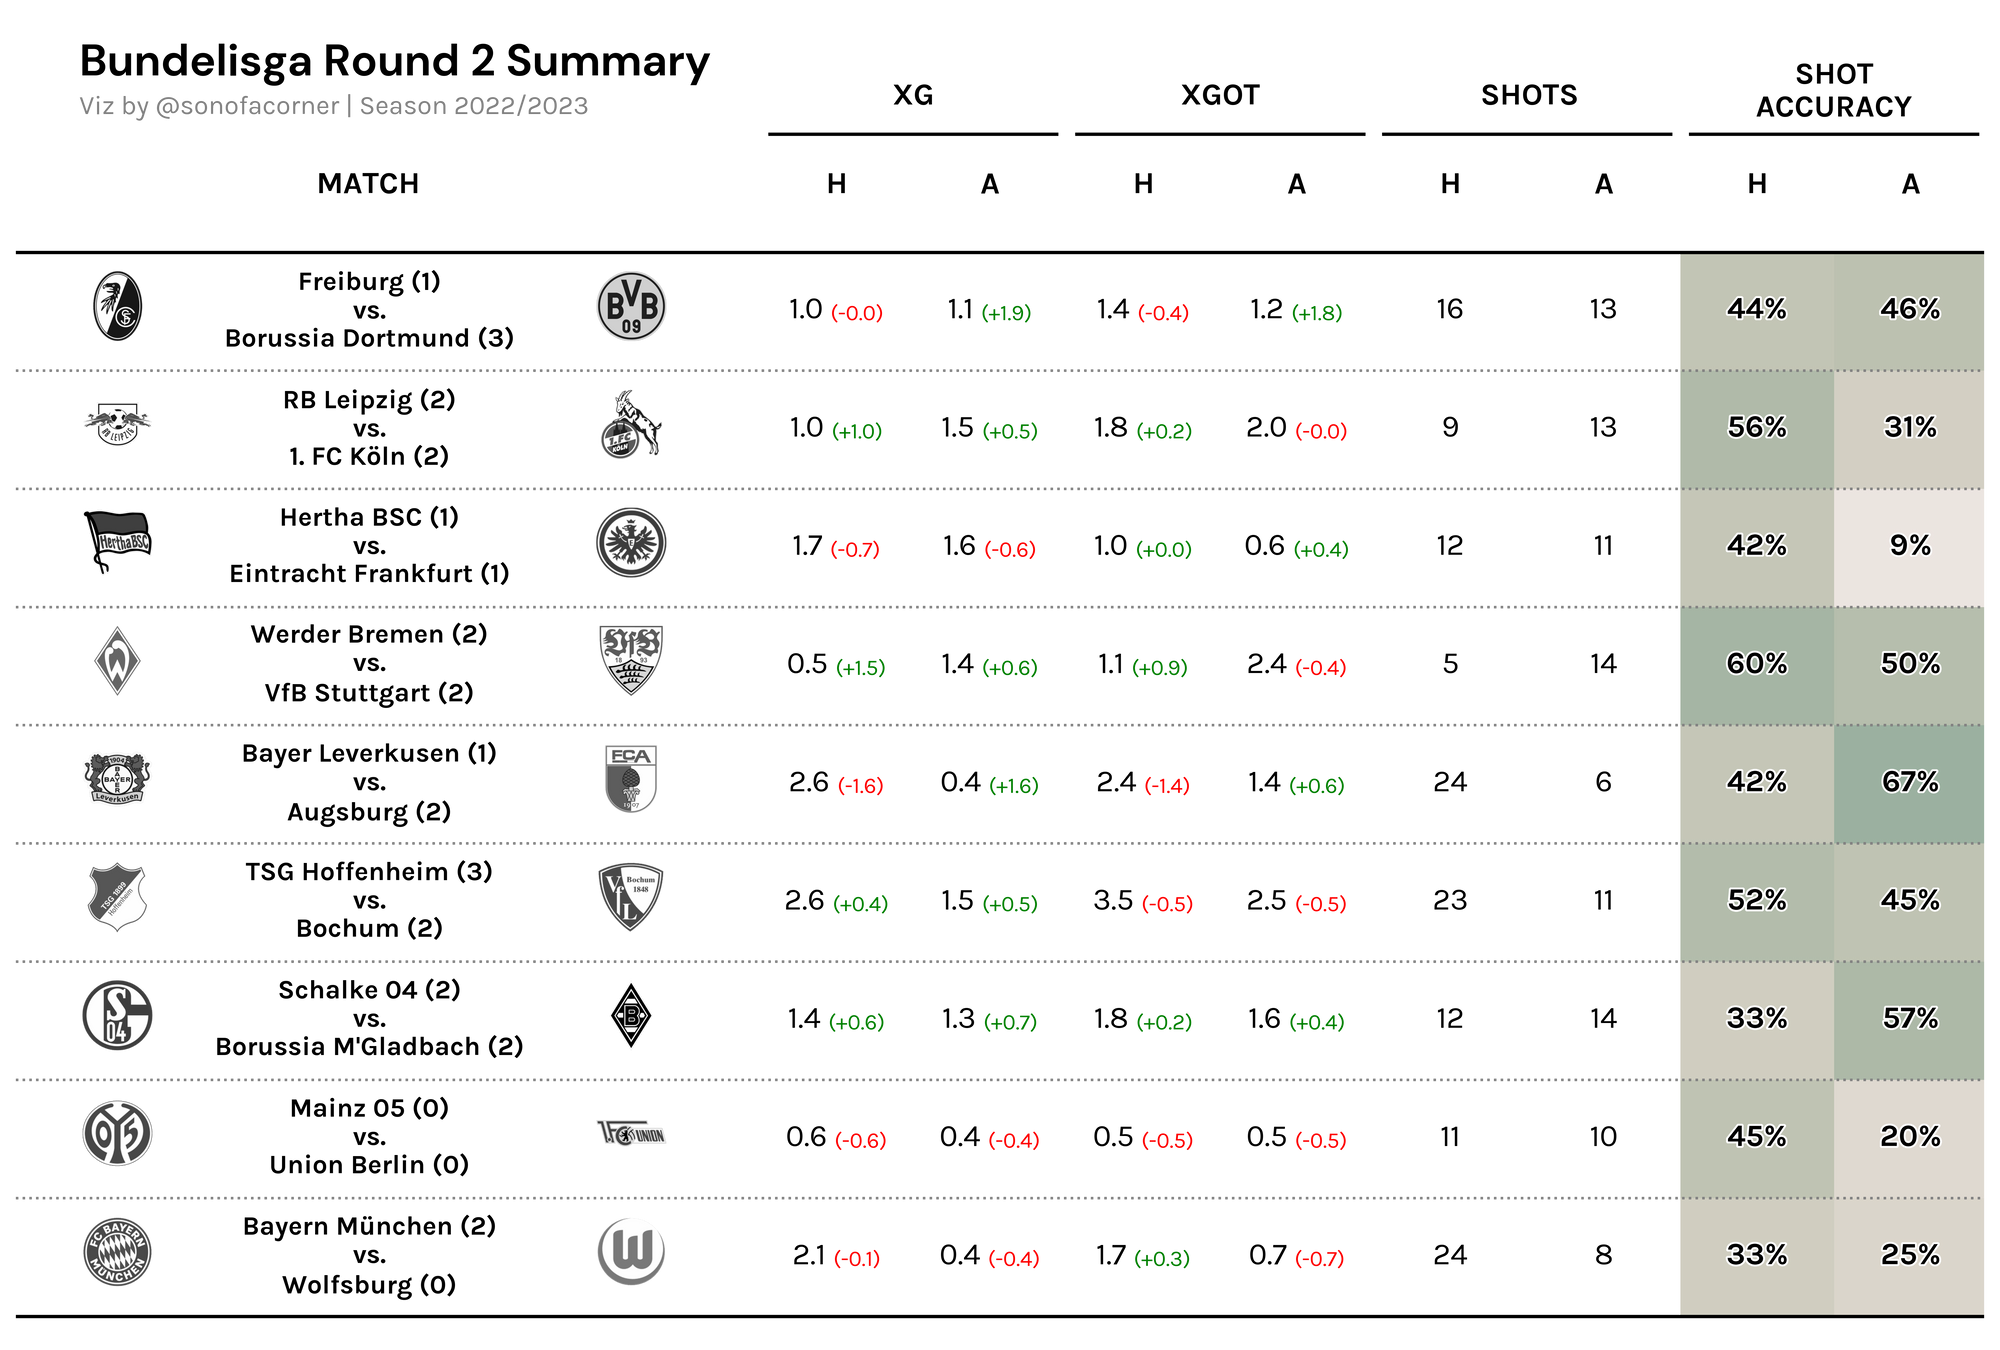
The idea was to at least give an idea of how to add logos, gradients, and some funky text to a matplotlib table, so I really hope this can give some color on how that's done.
From Around the Grounds
I recently added a new section to the newsletter where I highlight visuals or articles that caught my attention during the week, if you'd like to be featured @ me on Twitter so I can see your work 😊.
Real Madrid vs. Valencia Lollipop Chart by @OTStats
Really happy that the lollipop charts caught on!
Here's a great usage of the design by Owen with La Liga data. Hope to see more of these as the season progresses.
Well .@sonofacorner, I enjoyed your take on the xG lollipop charts so much that I wanted to replicate it using #RStats. Far from perfect but I needed to cut myself off at some point last night. Bring on #LaLiga Friday! 💪🇪🇸 pic.twitter.com/PPVX5A3eOr
— Owen Thompson (@OTStats) August 10, 2022
Wycombe Wanderers Points per Season by Alex Prior
Alex followed the Figuring Figures Out tutorial to create this awesome viz of Wycombe's historic points since 2005.
Some good use of annotations and scatters to give the data more context 👏.
Thanks for that, it’s definitely better now pic.twitter.com/FnGUpZ1tRe
— A.Prior (@AlexPrior10) August 4, 2022
The Notion of Probability by Lionel Page
This is not football or matplotlib related, but I wanted to highlight it anyway.
Lionel goes deep into the notion of probability by exploring Leonard Savage's Foundations of Statistics which essentially are the principles that give birth to Bayesian statistics.
If you're interested in stats and probability, this is a must-read.
The notion of “probability” is both familiar (we use it), and mysterious (we would typically struggle to define it).
— Lionel Page (@page_eco) August 14, 2022
Here is a 🧵 to remove the mystery and make the meaning of “probability” more intuitive. pic.twitter.com/3SuzjEyjG9
The code
I hope you enjoyed today's post. As always, you're welcome to take a look at my code and reproduce the visual.
All you need to do is check out my GitHub to get access to the notebook and the data behind it.
If you enjoy these posts and charts, please help me by subscribing to my website and sharing my work.


