


Hi everyone!
Welcome to the ninth issue of the Viz of the Week newsletter, where I'll be featuring a new visual each week and sharing the code behind it.
I want to give a warm welcome to the 21 new subscribers that joined this week. 🤍
If you haven't subscribed and wish to receive these posts straight to your inbox, subscribe to join the community and receive free updates!
Club football is back, and with it comes plenty of data to analyze and play with.
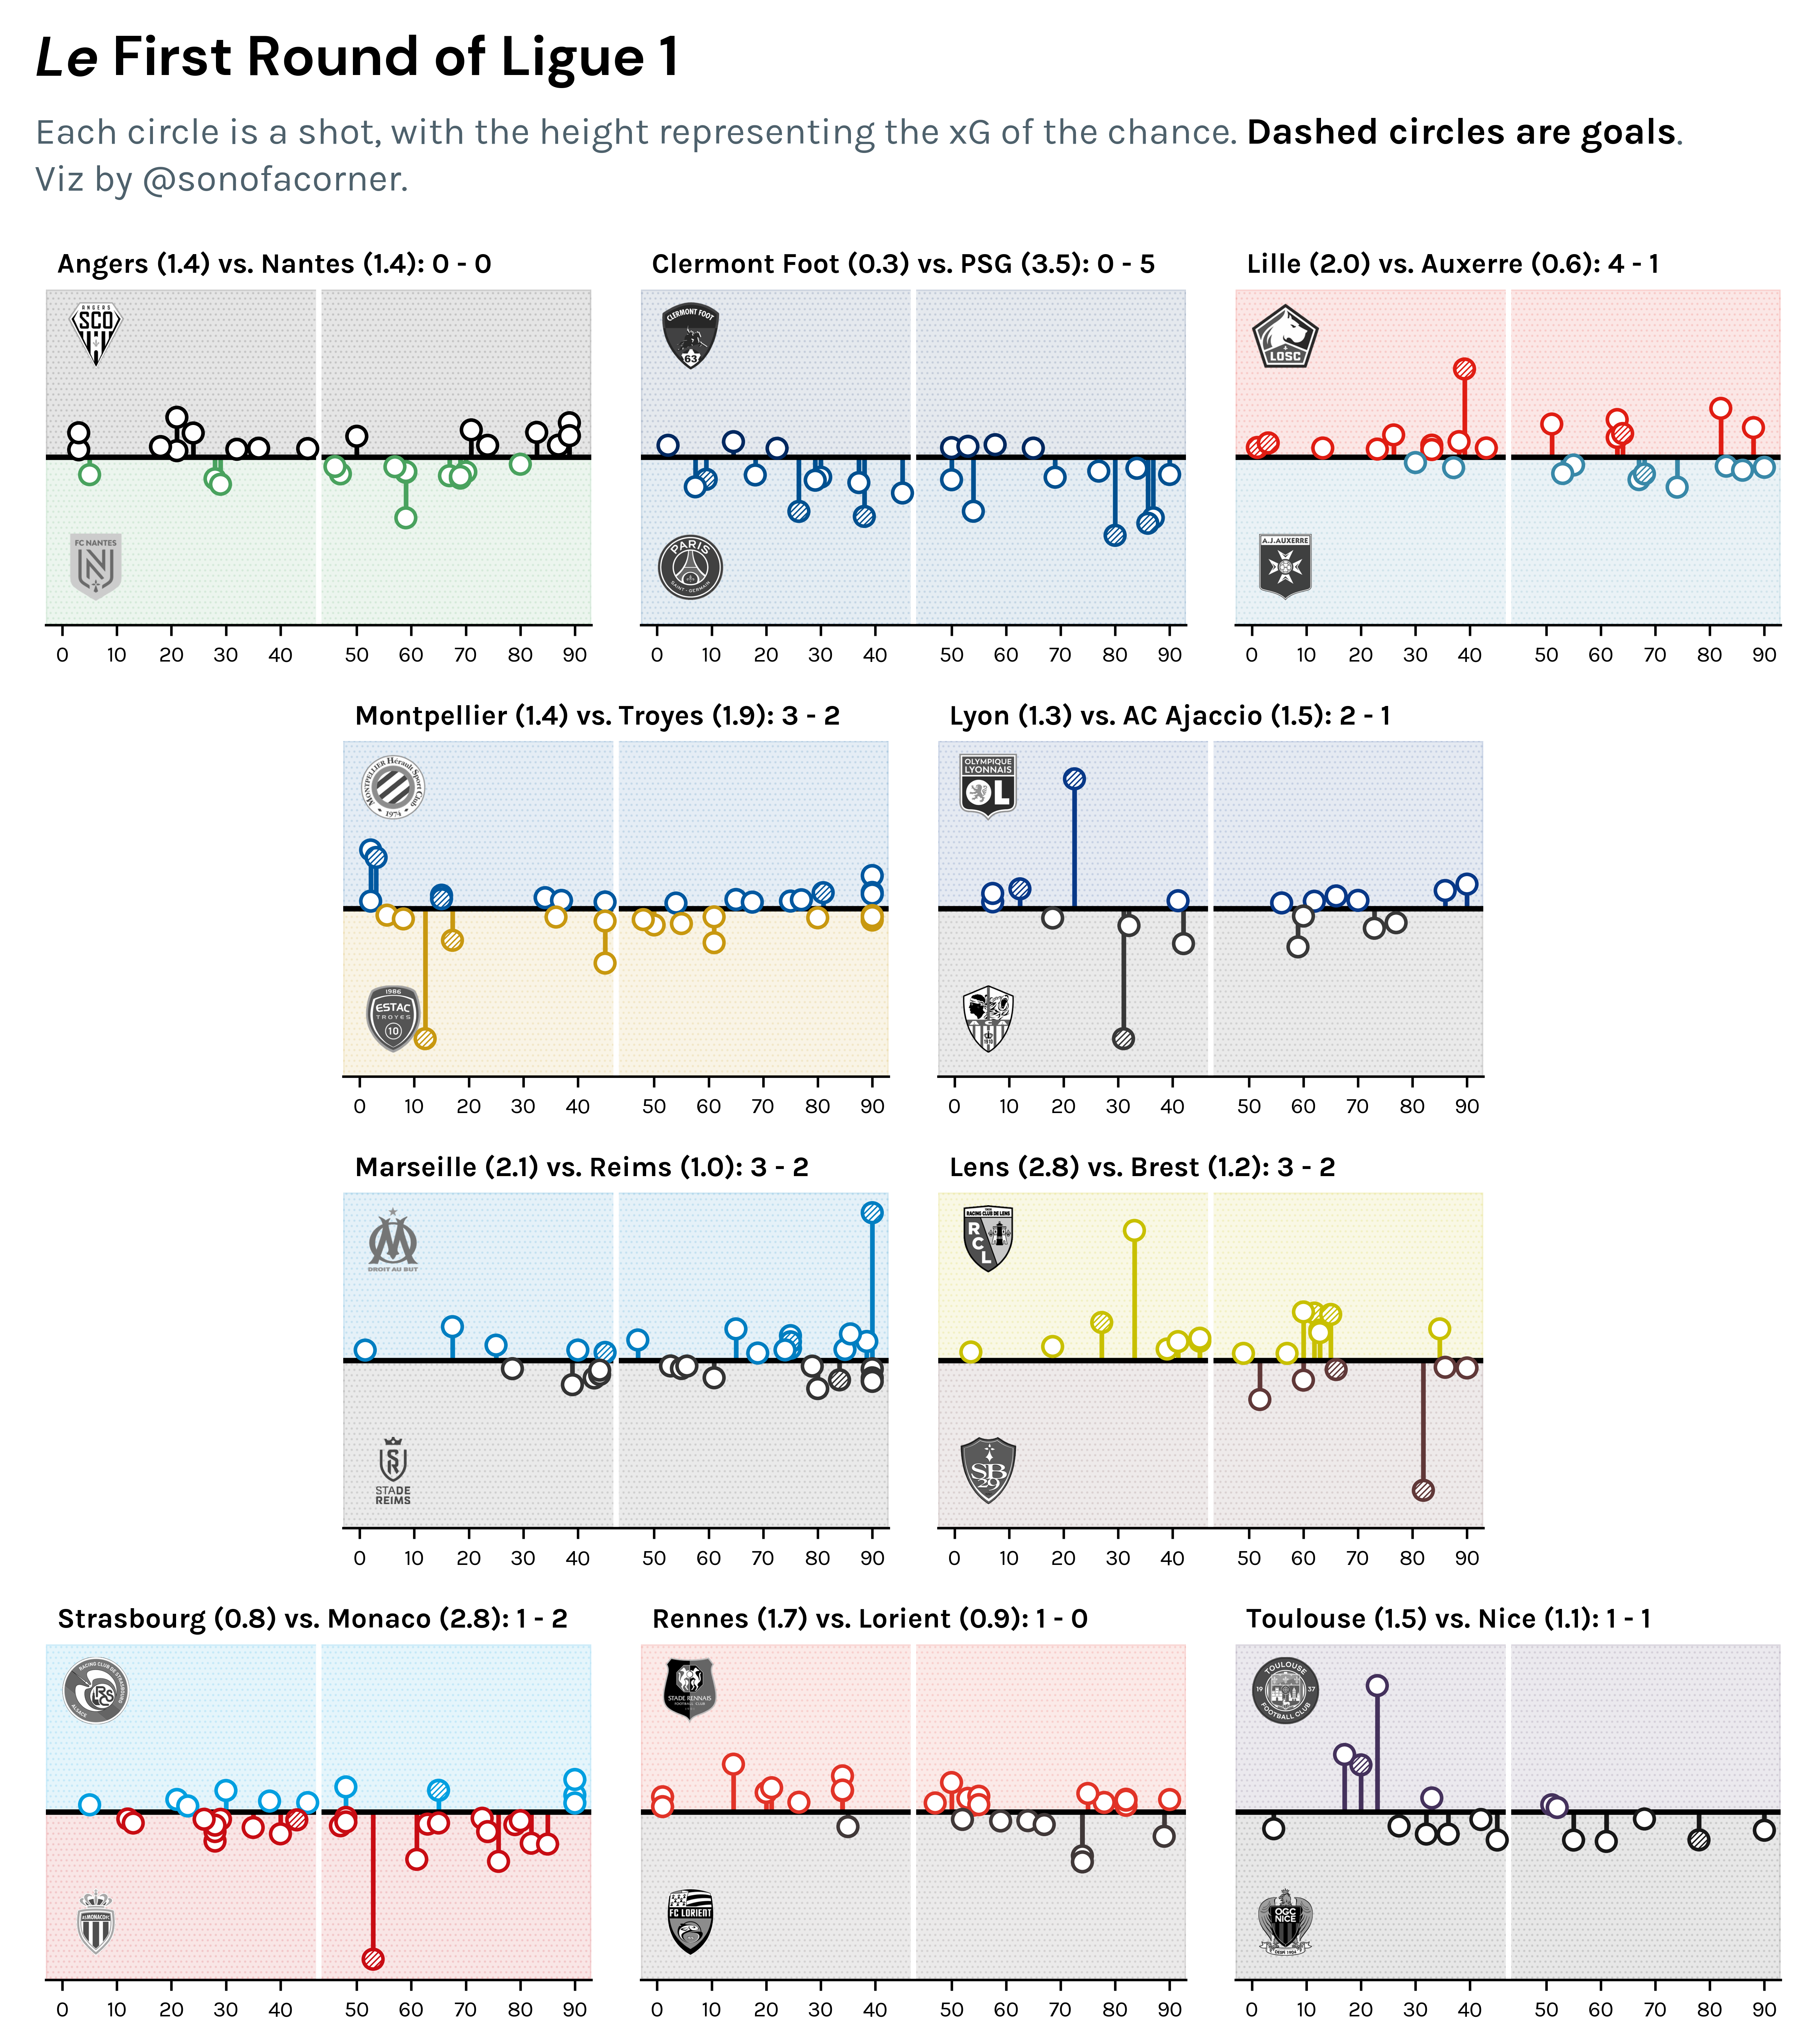
This week I was inspired by a visual I saw in the timeline from one of the greats in football analytics, David Sumpter, the author of Soccermatics.
Missed the first half. What happened!?! pic.twitter.com/5NhJ8m5HAd
— David Sumpter (@Soccermatics) July 31, 2022
Even though cumulative xG plots are the most common to show the danger created by teams within a certain fixture, I thought that making visualizing that same data through a lollipop chart would be a good idea. And a fun one at that.
To be honest, I'm really proud of how pleasing this looks on the eye. However, I do have to admit that the common cumulative xG charts may do a better job at clearly communicating the data.
What do you think?
Note: the layout was made using the subplot_mosaic method and you can have a deeper insight on this by reading my most recent matplotlib tutorial.

From Around the Grounds
I'm adding a new section to the newsletter where I'll highlight visuals or articles that caught my attention during the week, if you'd like to be featured @ me on Twitter so I can see your work 😊.
Shot Map Template by @_JKDS_
Superb Brighton performance, and can't say they didn't deserve the 3 points! pic.twitter.com/mzlKnWMO8e
— JK (@_JKDS_) August 7, 2022
Are Attacking Roles Changin? by Shreyas
Based on data from the 21/22 season, the expected output difference for the average player (divided into 4 age groups) gets more pronounced as we move from younger age groups to older ones
— Shreyas (@khatri_shreyas) August 7, 2022
Younger DFs and MFs contribute more than their peers, while younger FWs contribute lesser pic.twitter.com/NxcSVvwGYf
League Two Match Template by @xG_data
Expected Goals Timelines for Saturday's games in League Two (1/3)
— xG Data (@xG_data) August 6, 2022
Barrow v Bradford
Colchester v Carlisle
Crawley v Leyton Orient
Crewe v Harrogate#EFL | #SkyBetLeagueTwo#BarrowAFC v #BCAFC | #ColU v #cufc | #TownTeamTogether v #LOFC | #CreweAlex v #ProudToBeTown pic.twitter.com/vwEm3SVZZt
The code
I hope you enjoyed today's post. As always, you're welcome to take a look at my code and reproduce the visual.
All you need to do is check out my GitHub to get access to the code and data behind it.
If you enjoy these posts and charts, please help me by subscribing to my website and sharing my work.
Catch you on Thursday for this week's Premier League predictions 👋


