


Hi everyone, welcome to a new SOC tutorial 🙋♂️
In this post, I'll explore my preferred method to extract data directly from the web, which can be extremely efficient to collect data with just a couple of lines of code, with the added benefit that you don't need to clean HTML tags or worry about using tools such as Selenium.
For this particular example, we'll be scraping FiveThirtyEight's end-of-season projections, and I'll also throw in the code for a cool visual at the end of the post. I really hope you enjoy it and find it helpful!
If you weren't aware, I recently launched a paid membership program through which the community can support the improvement and content available on the website. One of the perks of becoming a member is that you get early access to tutorials – so if you consistently get value out of this site, I'd appreciate it if you'd consider joining us.
Inspecting a website
Learning how websites work is a good starting point for those new to web scraping. You don't need to know how to create one from scratch, but knowing the very basics does help a ton to make your life easier. A good resource to get started is this excellent article.
Having said that, a website is essentially a collection of data (text, images, etc.). Every time you visit one, data is sent from the server to your computer (the client) and is rendered into a tidy format which is what your browser shows you.
Let's look at FiveThirtyEight's prediction site as the primary example.
To view the site's underlying raw data – instead of the rendered data – we can simply right-click in any area of the webpage and select the Inspect option on the drop-down menu (if you're on a Mac and having trouble, read this). Once you do that, you should see something similar to the image below.
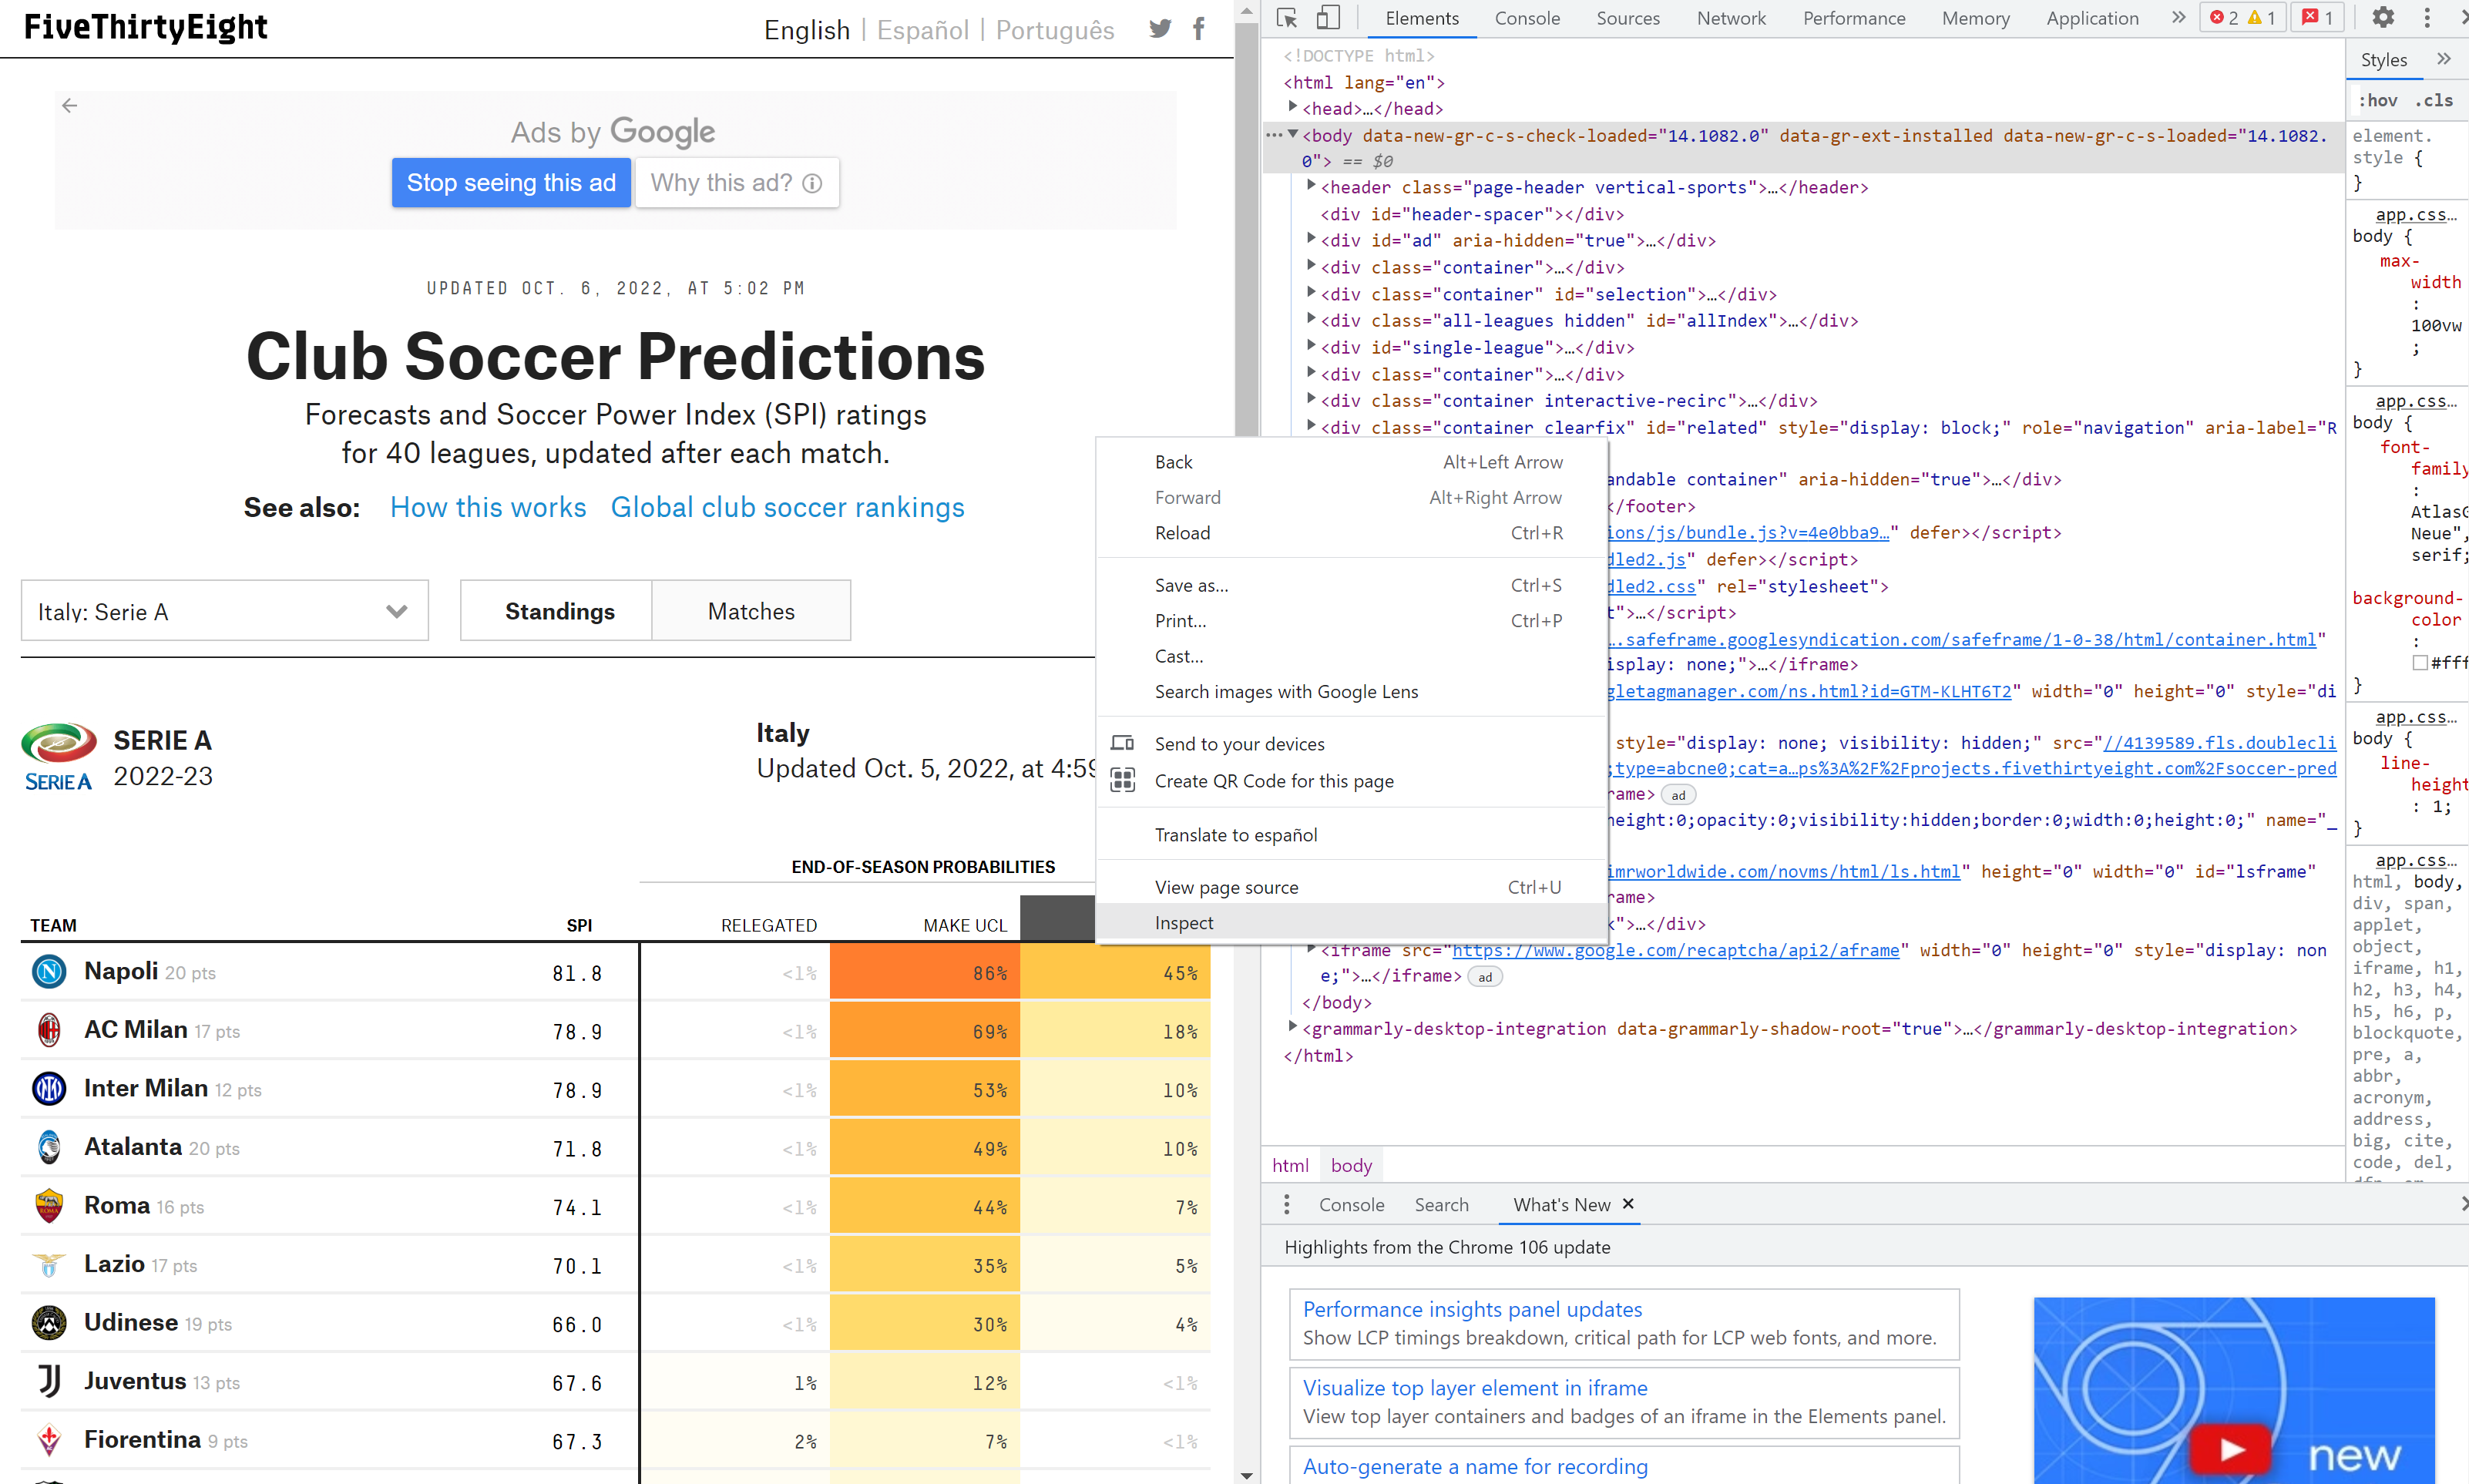
This window, called DevTools, shows us the underlying HTML code that generates the content displayed on the site.
Be smart and use the network tab
As you can see from the previous picture, that's a lot of text, so we need to be wise when searching for the data we wish to extract so that we write the least possible amount of code.
My preferred approach when scraping any site is first to visit the Network tab, which you can find on the top-right of the developer tools window. If you click it, you'll see all of the requests being made by your computer to fetch the data from the server; this includes everything from documents, images, fonts, etc.

In many cases, the site fetches the underlying data in a friendly and tidy format and then uses Javascript to create the final HTML.
These types of requests are called XMLHttpRequest (XHR) and they are designed to retrieve data from a URL without having to do a full page refresh. This enables the website to update just part of a page without disrupting what the user is doing.
In the case of FiveThirtyEight's site, we can see that we can navigate across different leagues, seasons, and forecast dates without the page having to perform a full refresh; this suggests that there is a high chance that XHR requests are being made on the background. As you'll see in this tutorial, this will turn out to be quite advantageous for us.
To view only the XHR requests being made, click on the Fetch/XHR filter button on the top of the Developer Tools window.
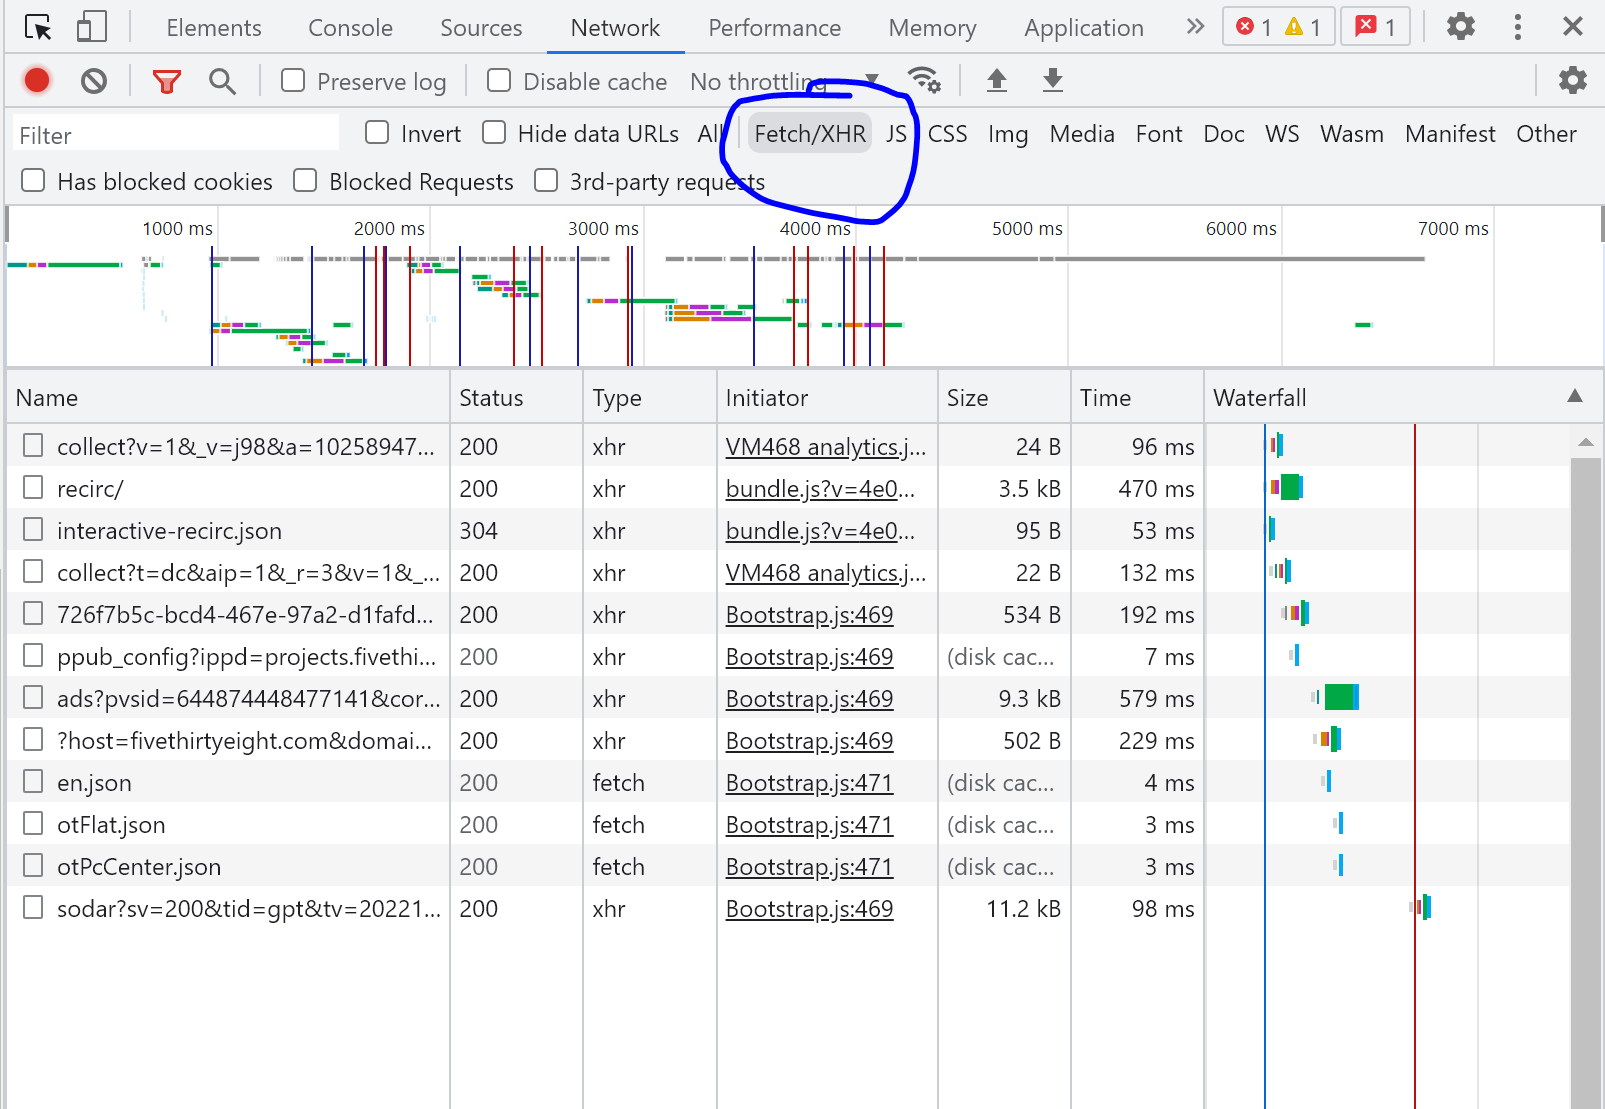
Much less garbage right?
Now let's go ahead and see if the website performs any new requests each time we interact with the site.
As you'll see in the GIF below, every time I change the selection of the forecast date, the website performs a new request.
Cool. It seems as though the site is getting the forecast data from another service or URL, let's now click on those requests to see what they contain.
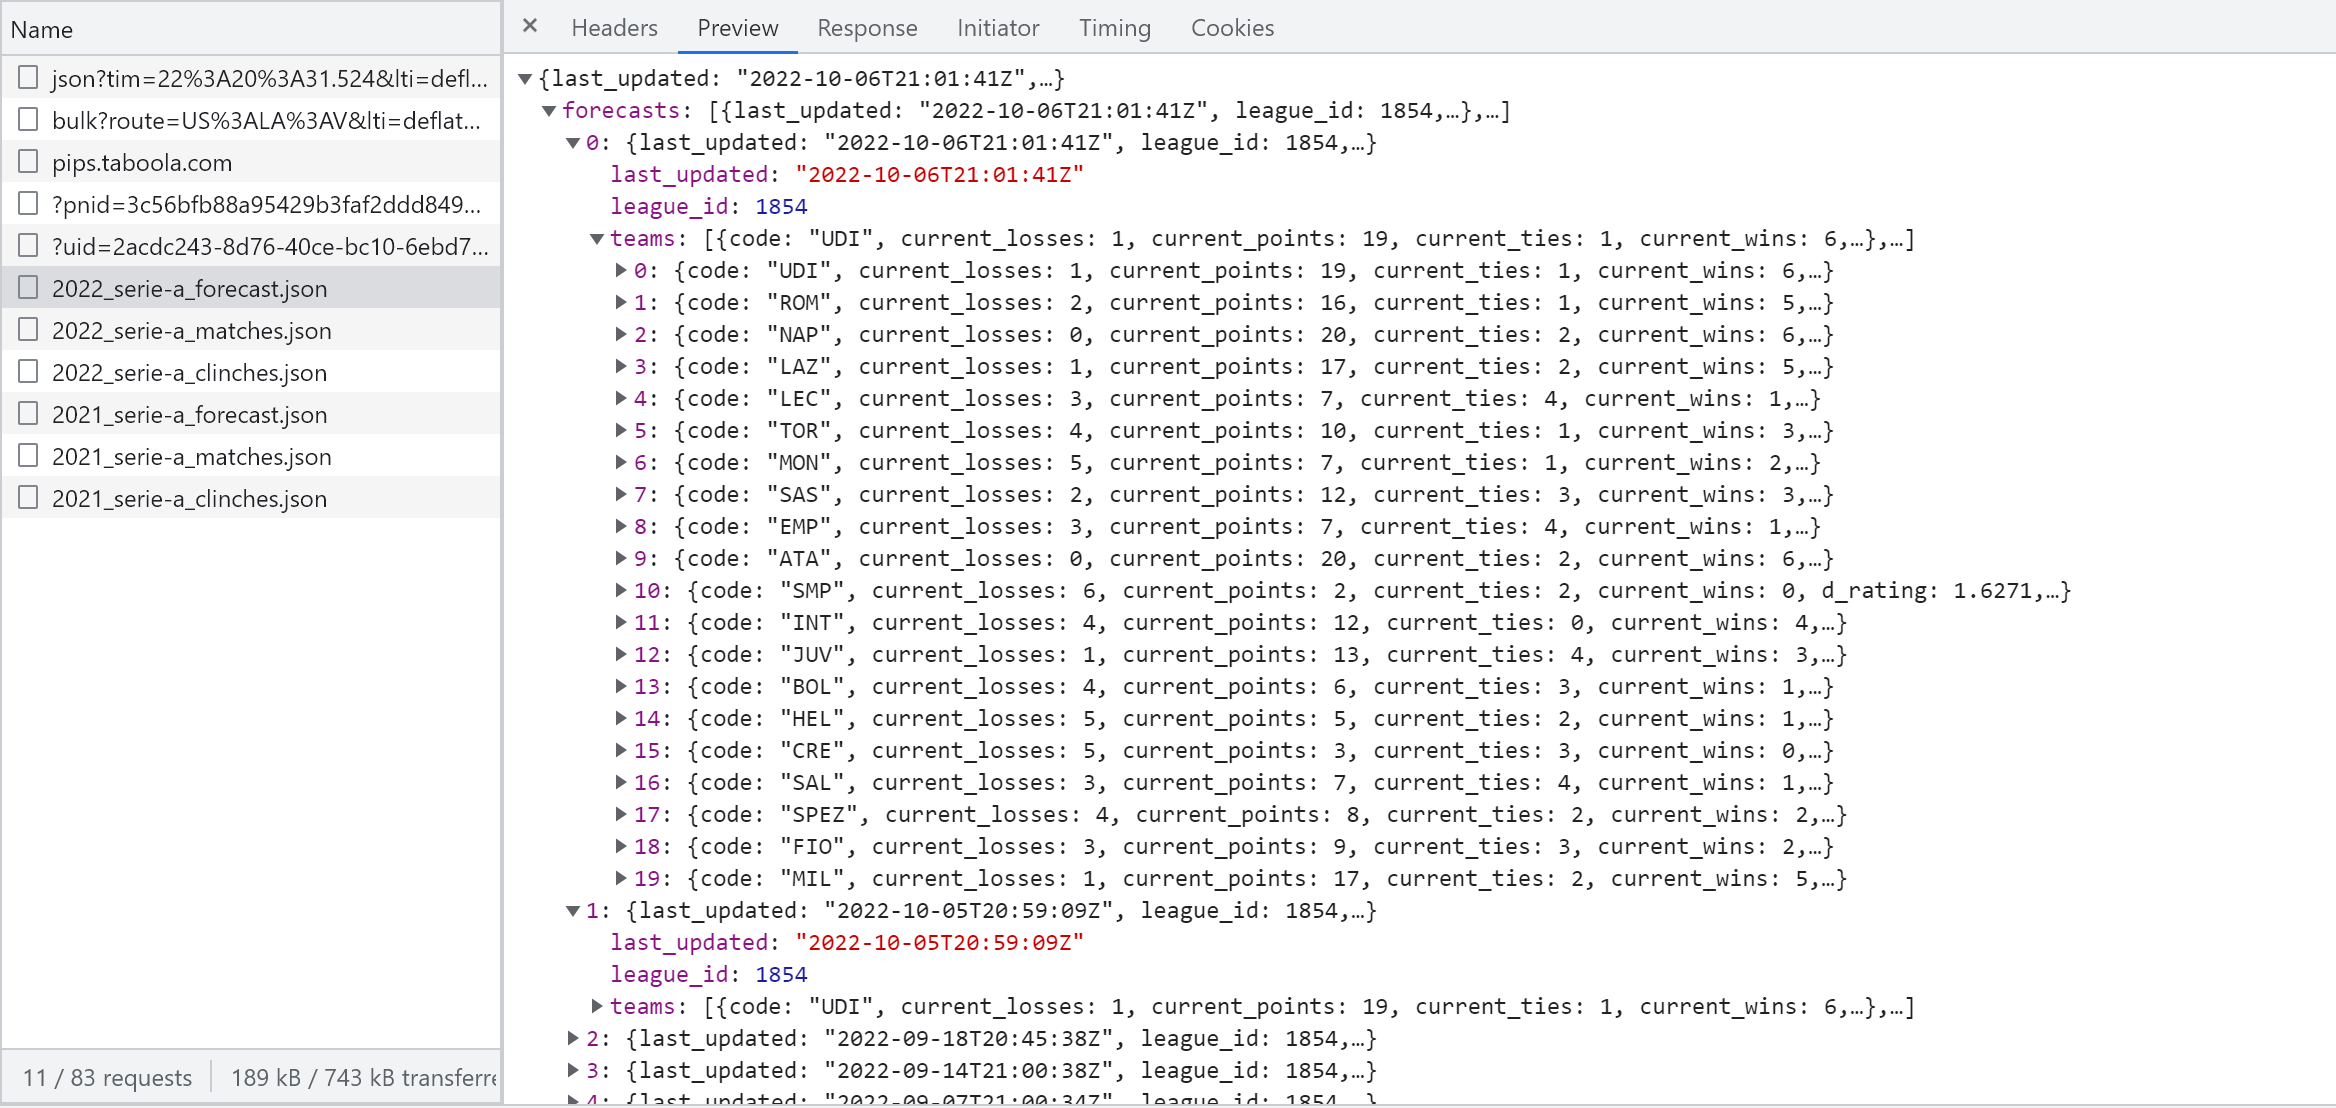
As you can see from the request names, we have a request called 2022_serie-a_forecast.json so it's likely that this request is collecting the data we're looking for. To verify this, click on the request, and a new subwindow should open up.
This subwindow contains a couple of tabs, the most important are the Headers tab and the Preview tab. The former contains the information sent to perform the request, whereas the latter contains the content of the response – which, lucky for us, is the data we need in a tidy JSON format.
How do we replicate this request in Python to get the data?
This is where things can get tricky, as some sites have strong anti-scraping measures which will require a bit more effort from our end (more on that for another time). However, in this particular case, you'll see that it's pretty straightforward.
If you click on the Headers tab you'll see a Request URL, which is where FiveThirtyEight calls the data to populate the table we see on the screen. Copy it, paste the URL on a new tab on your browser and hit enter.
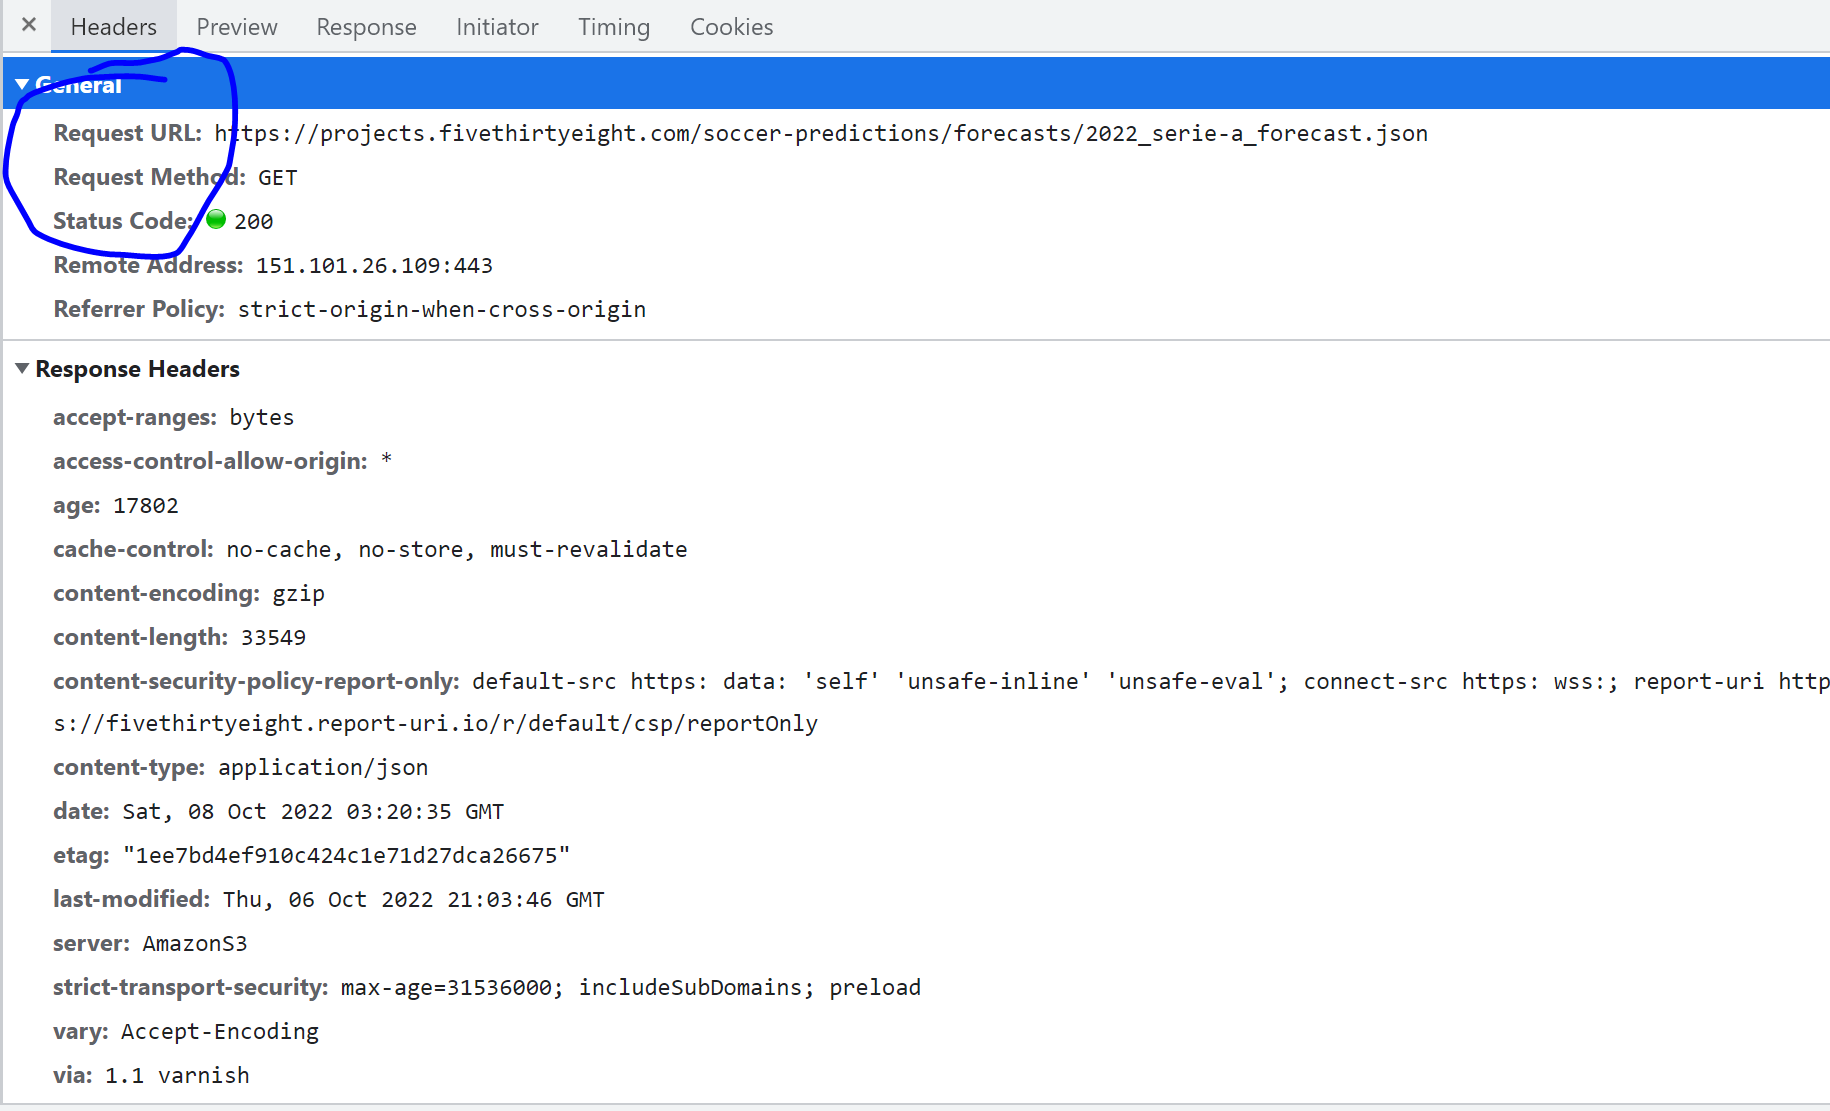
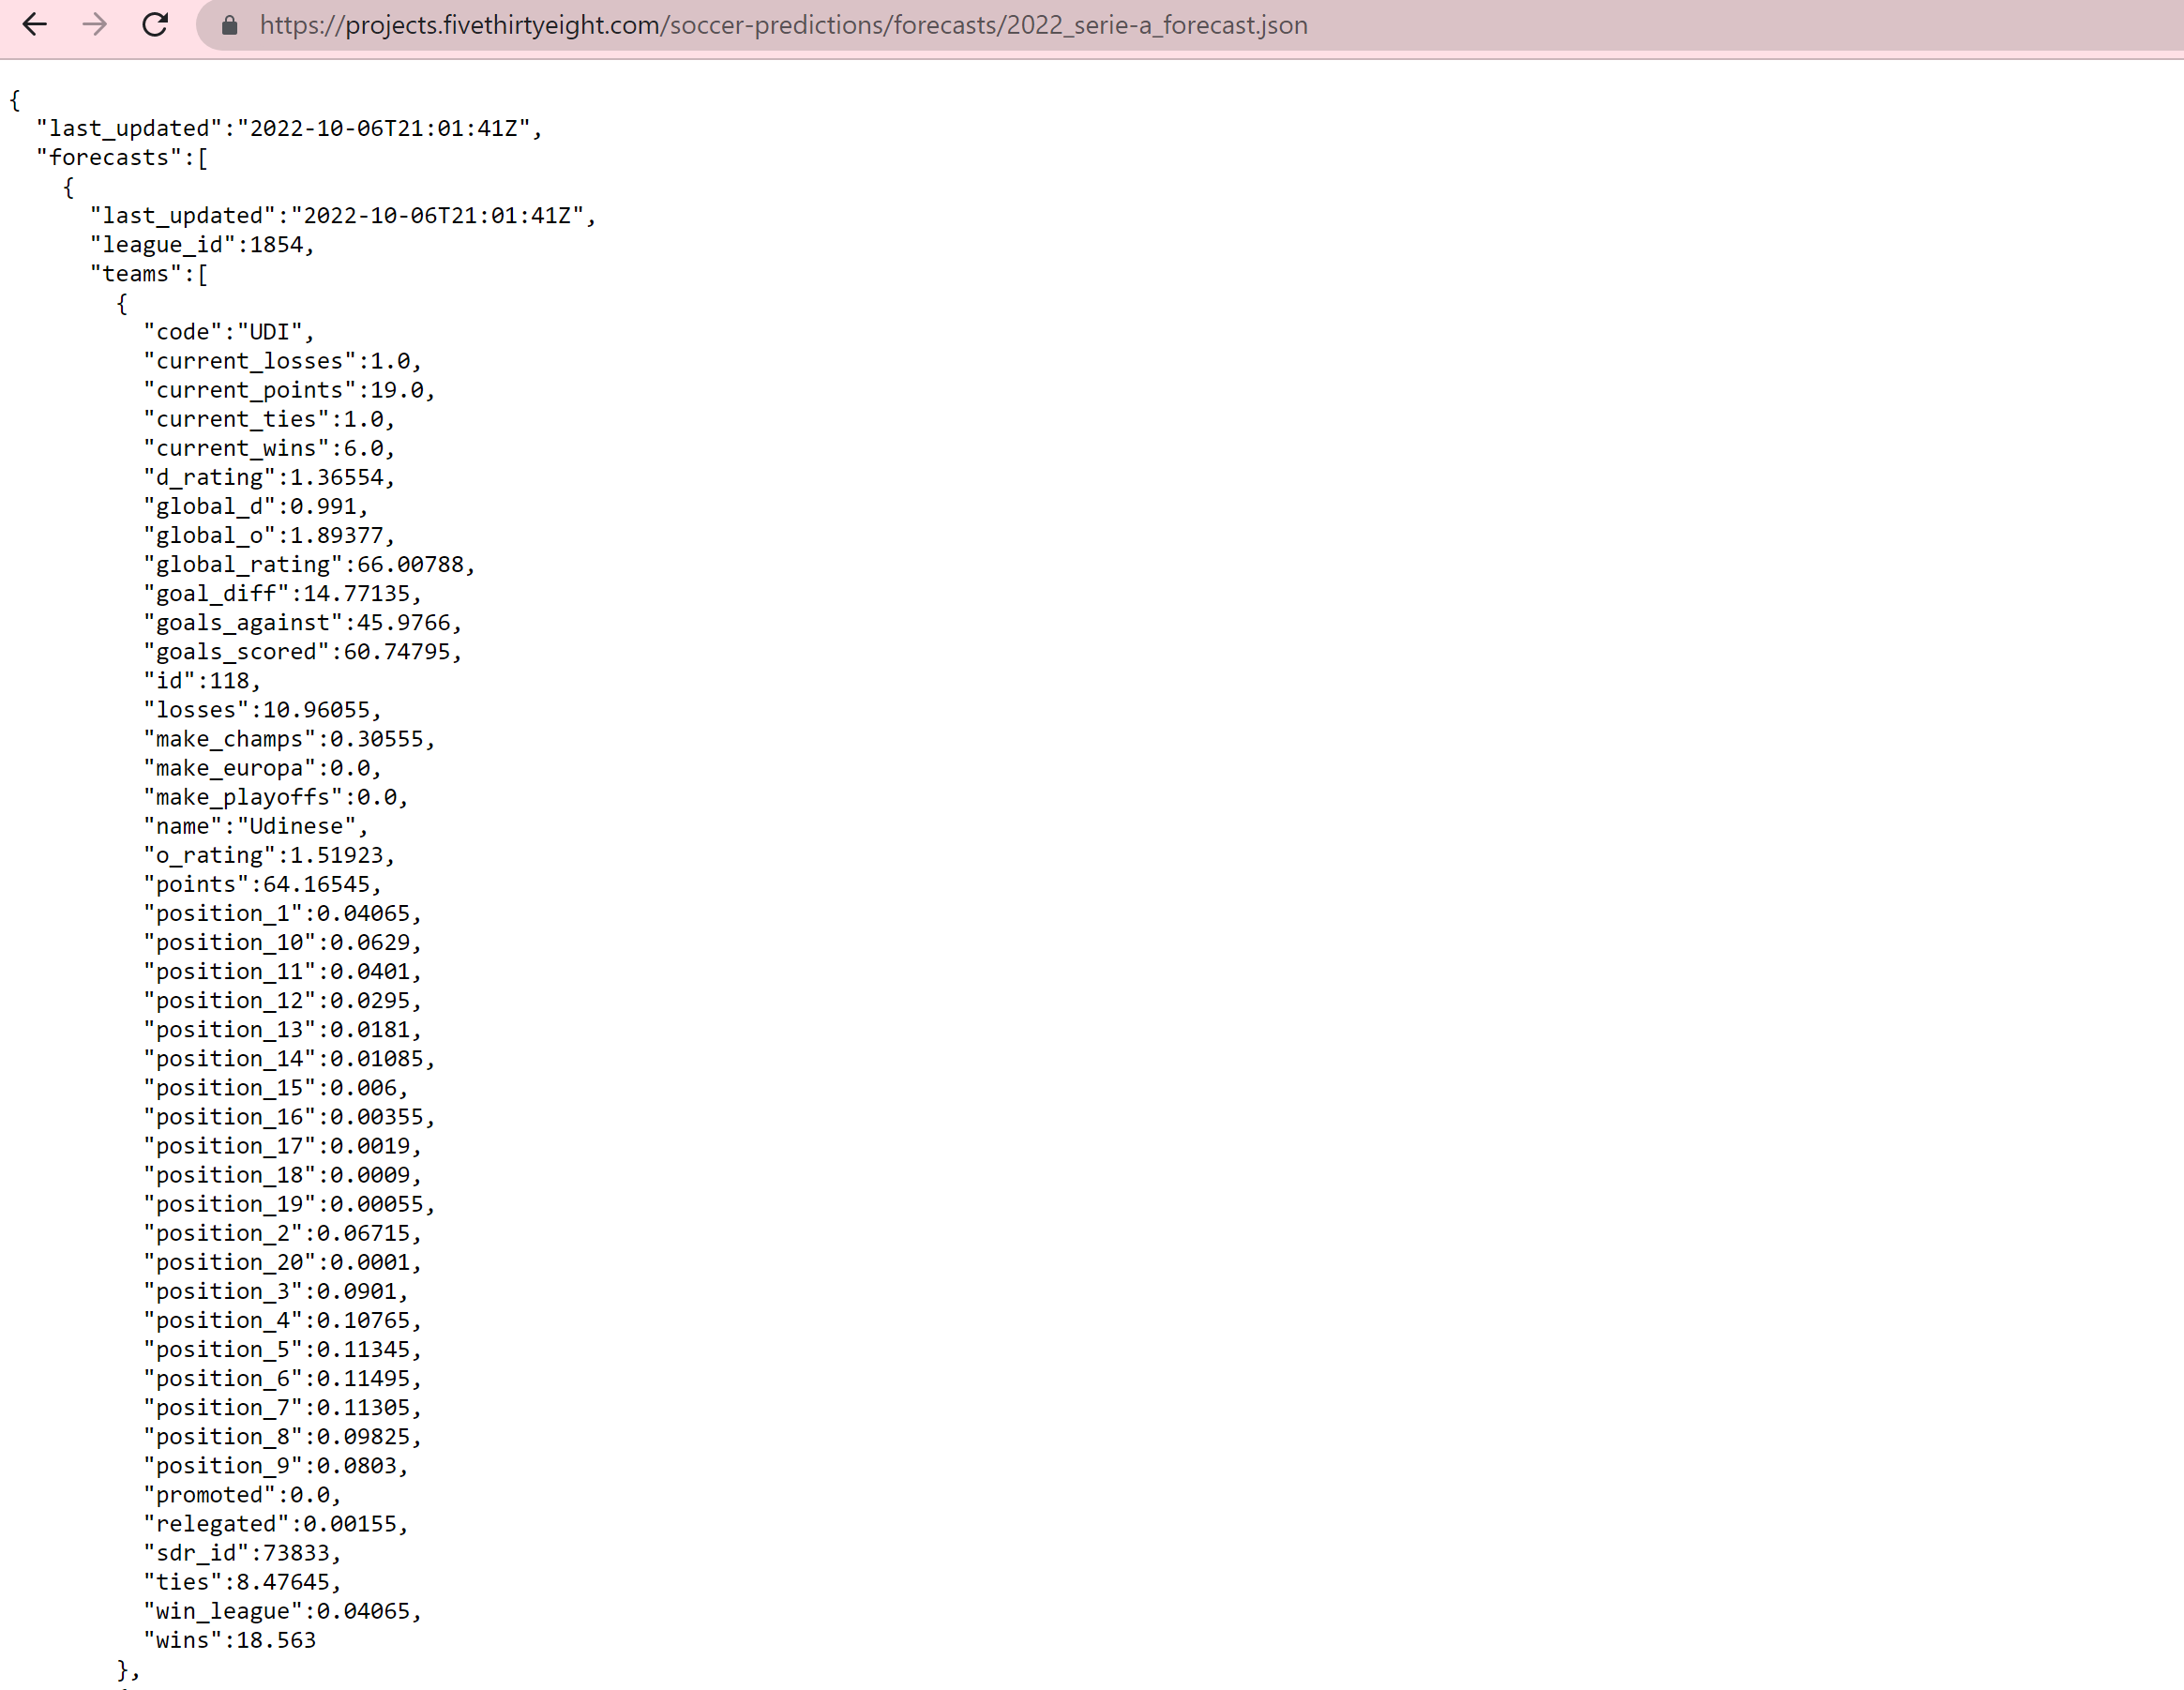
Amazing right? There's our data in a beautiful JSON format.
Time to code
Ok, now that we've got that covered it's time to load the data into Python.
Let's start by loading the libraries we'll need to collect the data.
import pandas as pd
import requests
import jsonrequests package via pip install requests.Now, let's call that URL using the requests package. For that, we simply need to specify the method of the request, which as you can check on the previous screenshots is being made via a GET method (more on that here).
response = requests.get('https://projects.fivethirtyeight.com/soccer-predictions/forecasts/2022_serie-a_forecast.json')
print(response.content)
As you might infer, the content attribute of the response is the actual content being returned by the request (a.k.a. our data). This should print a nasty string such as the one below, let's now tell python that this is actually a JSON.
b'{\n "last_updated":"2022-10-06T21:01:41Z",\n "forecasts":[\n {\n "last_updated":"2022-10-06T21:01:41Z",\n "league_id":1854,\n "teams":[\n {\n "code":"UDI",\n "current_losses":1.0,\n "current_points":19.0,\n "current_ties":1.0,\n "current_wins":6.0,\n "d_rating":1.36554,\n "global_d":0.991,\n "global_o":1.89377,\n "global_rating":66.00788,\n "goal_diff":14.77135,\n "goals_against":45.9766,\n "goals_scored":60.74795,\n "id":118,\n "losses":10.96055,\n "make_champs":0.30555,\n "make_europa":0.0,\n "make_playoffs":0.0,\n "name":"Udinese",\n "o_rating":1.51923,\ndata = json.loads(response.content)If you print it, you should see that the nasty text has now turned into a dictionary. Let's now put this into a pandas.DataFrame.
df = pd.DataFrame()
for forecast in data['forecasts']:
    aux_df = pd.DataFrame(forecast['teams'])
    aux_df = aux_df.assign(forecast_date = forecast['last_updated'])
    df = pd.concat([df, aux_df])
| | code | current_losses | current_points | current_ties | current_wins | d_rating | global_d | global_o | global_rating | goal_diff | goals_against | goals_scored | id | losses | make_champs | make_europa | make_playoffs | name | o_rating | points | position_1 | position_10 | position_11 | position_12 | position_13 | position_14 | position_15 | position_16 | position_17 | position_18 | position_19 | position_2 | position_20 | position_3 | position_4 | position_5 | position_6 | position_7 | position_8 | position_9 | promoted | relegated | sdr_id | ties | win_league | wins | forecast_date |
|---:|:-------|-----------------:|-----------------:|---------------:|---------------:|-----------:|-----------:|-----------:|----------------:|------------:|----------------:|---------------:|-----:|---------:|--------------:|--------------:|----------------:|:--------|-----------:|---------:|-------------:|--------------:|--------------:|--------------:|--------------:|--------------:|--------------:|--------------:|--------------:|--------------:|--------------:|-------------:|--------------:|-------------:|-------------:|-------------:|-------------:|-------------:|-------------:|-------------:|-----------:|------------:|---------:|---------:|-------------:|---------:|:---------------------|
| 0 | UDI | 1 | 19 | 1 | 6 | 1.36554 | 0.991 | 1.89377 | 66.0079 | 14.7713 | 45.9766 | 60.748 | 118 | 10.9605 | 0.30555 | 0 | 0 | Udinese | 1.51923 | 64.1655 | 0.04065 | 0.0629 | 0.0401 | 0.0295 | 0.0181 | 0.01085 | 0.006 | 0.00355 | 0.0019 | 0.0009 | 0.00055 | 0.06715 | 0.0001 | 0.0901 | 0.10765 | 0.11345 | 0.11495 | 0.11305 | 0.09825 | 0.0803 | 0 | 0.00155 | 73833 | 8.47645 | 0.04065 | 18.563 | 2022-10-06T21:01:41Z |
| 1 | ROM | 2 | 16 | 1 | 5 | 1.12789 | 0.75335 | 2.02779 | 73.9748 | 18.3039 | 39.2099 | 57.5138 | 104 | 9.71645 | 0.4422 | 0 | 0 | AS Roma | 1.65325 | 67.9851 | 0.0699 | 0.03795 | 0.023 | 0.0158 | 0.0091 | 0.0055 | 0.00295 | 0.00185 | 0.0005 | 0.00035 | 0.0001 | 0.11185 | 5e-05 | 0.12705 | 0.1334 | 0.1264 | 0.1095 | 0.09645 | 0.0741 | 0.0542 | 0 | 0.0005 | 73831 | 8.4328 | 0.0699 | 19.8508 | 2022-10-06T21:01:41Z |
| 2 | NAP | 0 | 20 | 2 | 6 | 1.08305 | 0.70851 | 2.51226 | 81.775 | 44.3834 | 35.9554 | 80.3388 | 114 | 5.53475 | 0.86245 | 0 | 0 | Napoli | 2.13772 | 81.0162 | 0.4535 | 0.0038 | 0.00155 | 0.0011 | 0.00035 | 0.0003 | 0.0001 | 5e-05 | 5e-05 | 5e-05 | 0 | 0.20595 | 0 | 0.1211 | 0.0819 | 0.05475 | 0.03465 | 0.02195 | 0.01185 | 0.007 | 0 | 5e-05 | 73848 | 8.18975 | 0.4535 | 24.2755 | 2022-10-06T21:01:41Z |
| 3 | LAZ | 1 | 17 | 2 | 5 | 1.32063 | 0.94609 | 2.05024 | 69.8979 | 22.3577 | 42.2328 | 64.5905 | 112 | 10.1542 | 0.33245 | 0 | 0 | Lazio | 1.67571 | 64.9977 | 0.0419 | 0.05635 | 0.0371 | 0.0274 | 0.01515 | 0.00965 | 0.00495 | 0.0032 | 0.0014 | 0.0009 | 0.0002 | 0.07975 | 5e-05 | 0.0973 | 0.1135 | 0.1182 | 0.119 | 0.1082 | 0.09355 | 0.07225 | 0 | 0.00115 | 73834 | 9.26975 | 0.0419 | 18.576 | 2022-10-06T21:01:41Z |
| 4 | LEC | 3 | 7 | 4 | 1 | 1.47306 | 1.09852 | 1.35504 | 51.7368 | -17.2159 | 51.4905 | 34.2745 | 113 | 17.3745 | 0.0022 | 0 | 0 | Lecce | 0.9805 | 37.6606 | 5e-05 | 0.0372 | 0.05235 | 0.06835 | 0.0827 | 0.09075 | 0.1002 | 0.1048 | 0.10765 | 0.10375 | 0.1008 | 0.00025 | 0.08565 | 0.00065 | 0.00125 | 0.00285 | 0.00595 | 0.01095 | 0.0174 | 0.02645 | 0 | 0.2902 | 73898 | 12.108 | 5e-05 | 8.51755 | 2022-10-06T21:01:41Z |B E A utiful!
Now we have a clean DataFrame with less than ten lines of code. Pretty amazing don't you think?
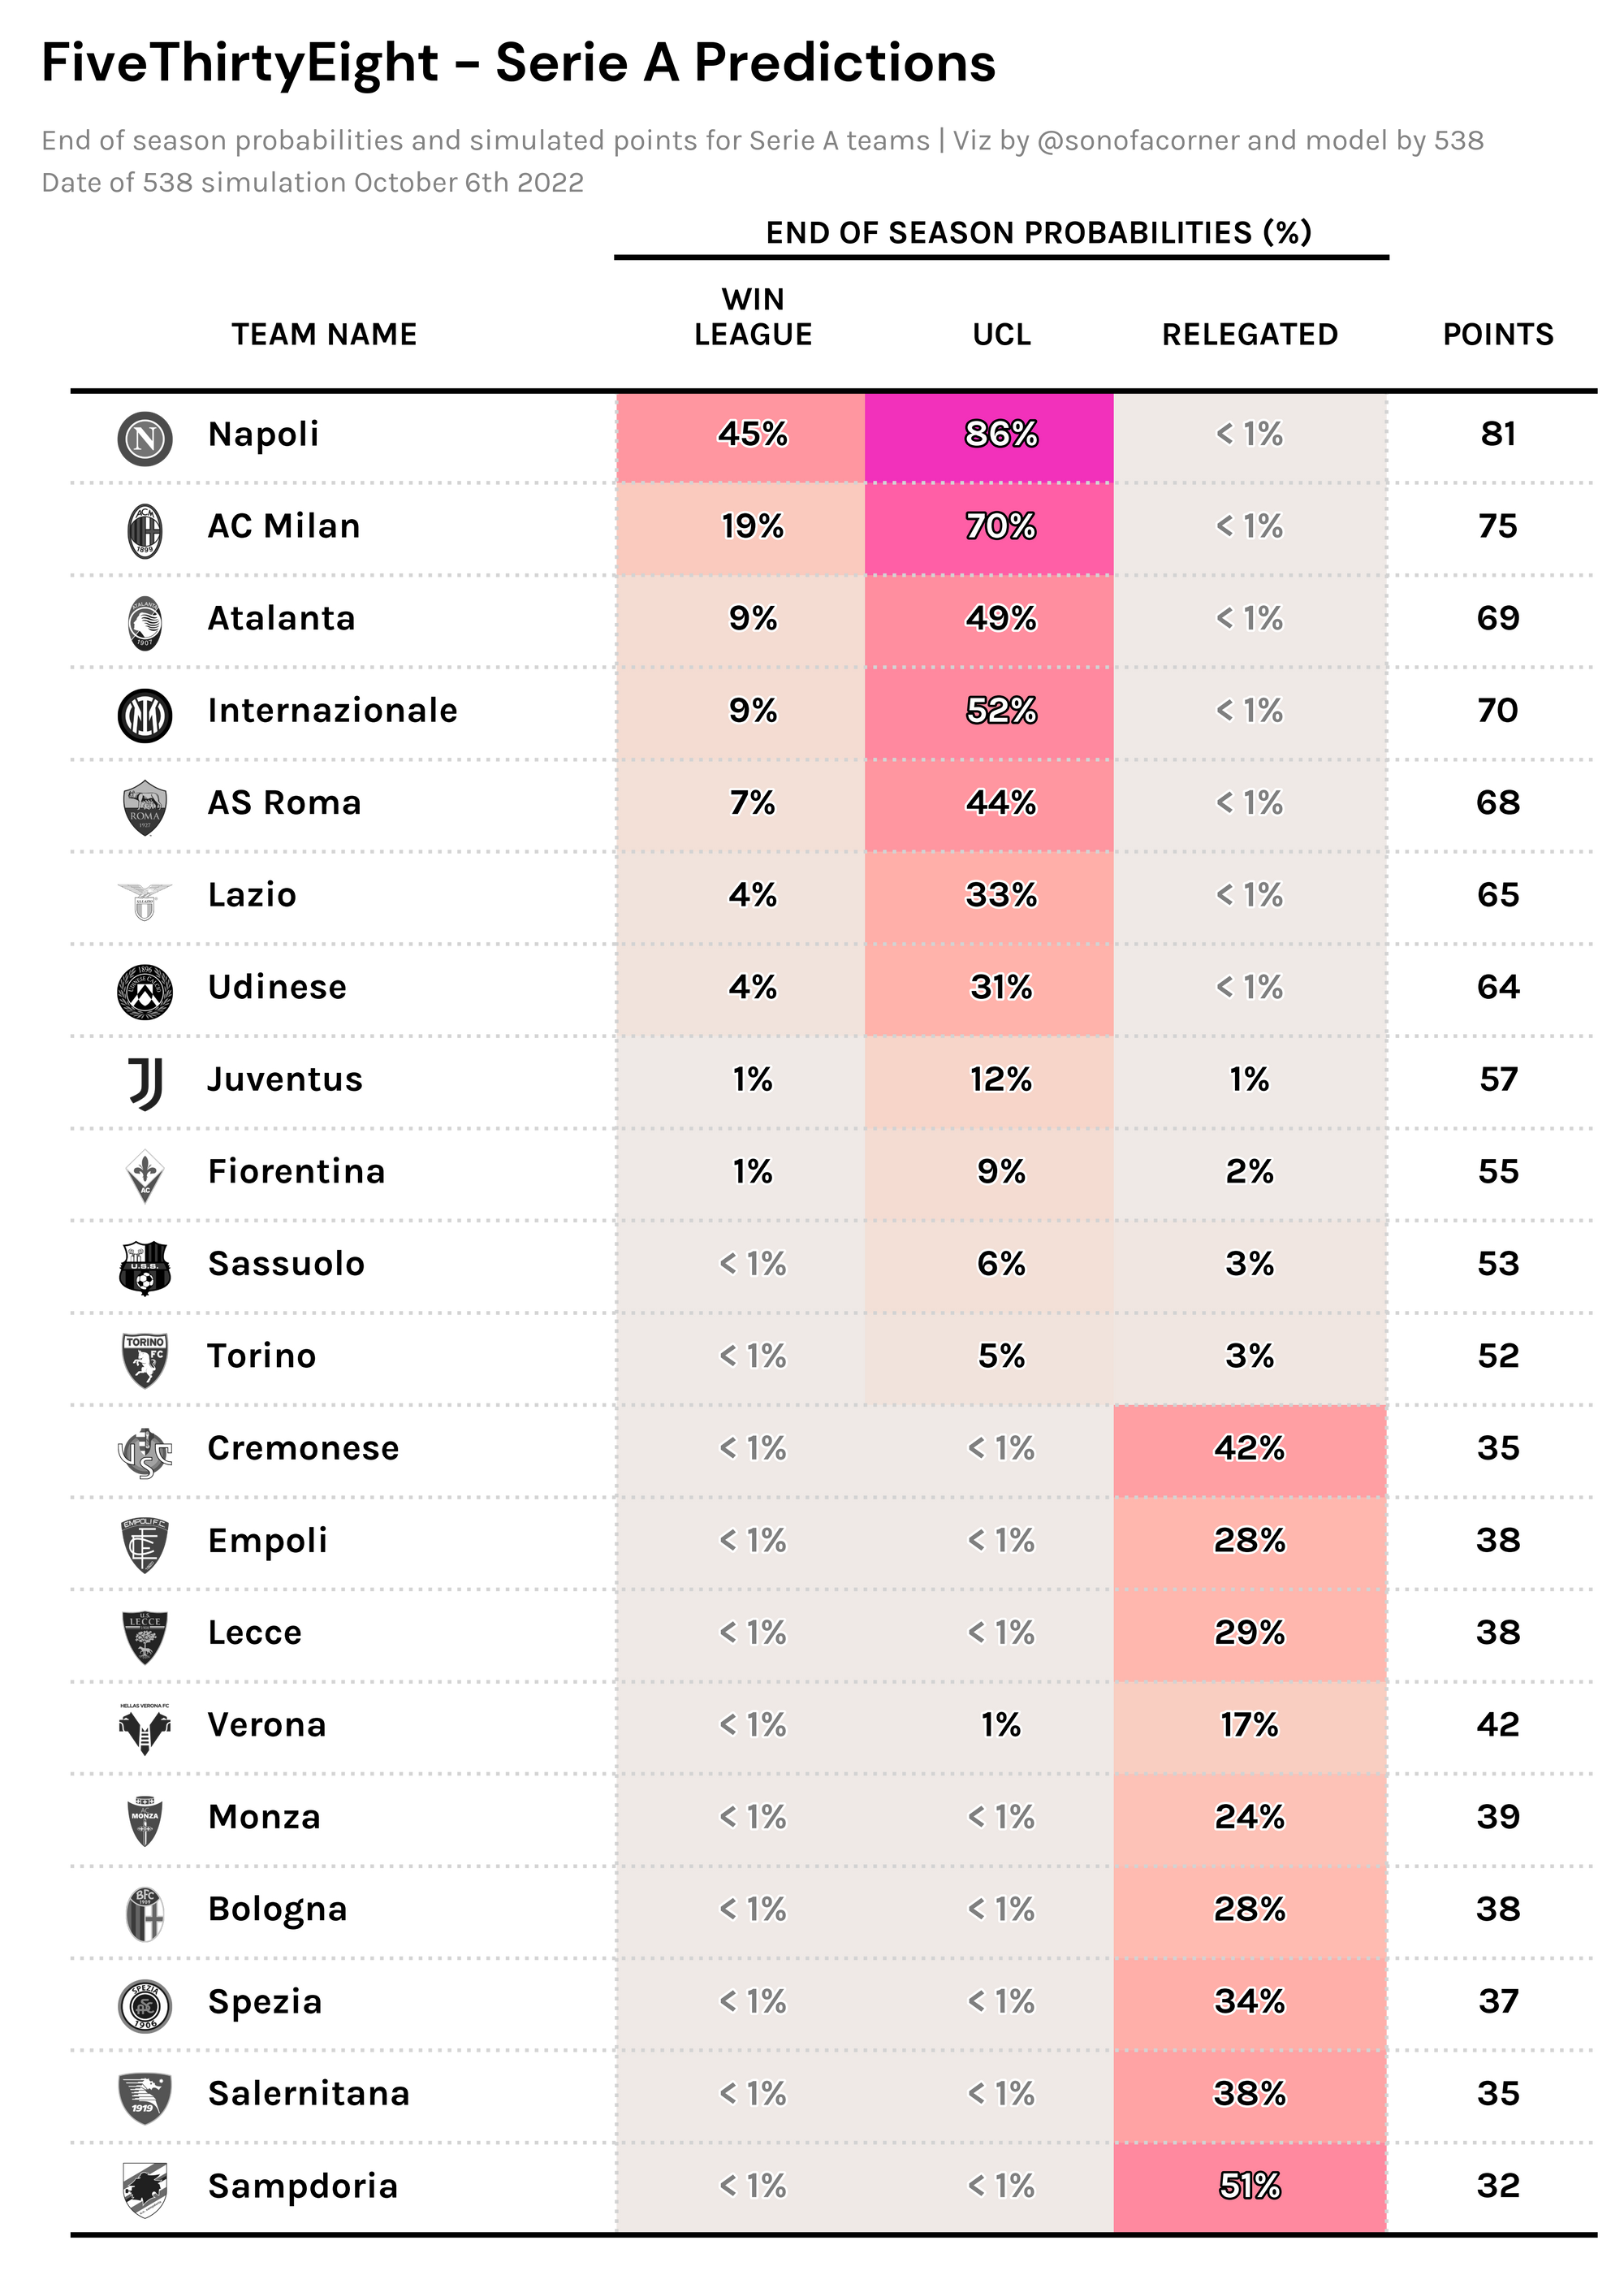
Bonus - A cool viz
Since some people have shown interest in my Premier League predictions visuals, I thought I should throw in the code on how to create something similar.
This part won't be a tutorial, I'll simply share the code behind it, which you can find in the accompanying notebook on my GitHub.
That's all for today, hope you enjoyed this tutorial and find creative ways to use the data we collected.
Take care and I'll catch you later 😎


